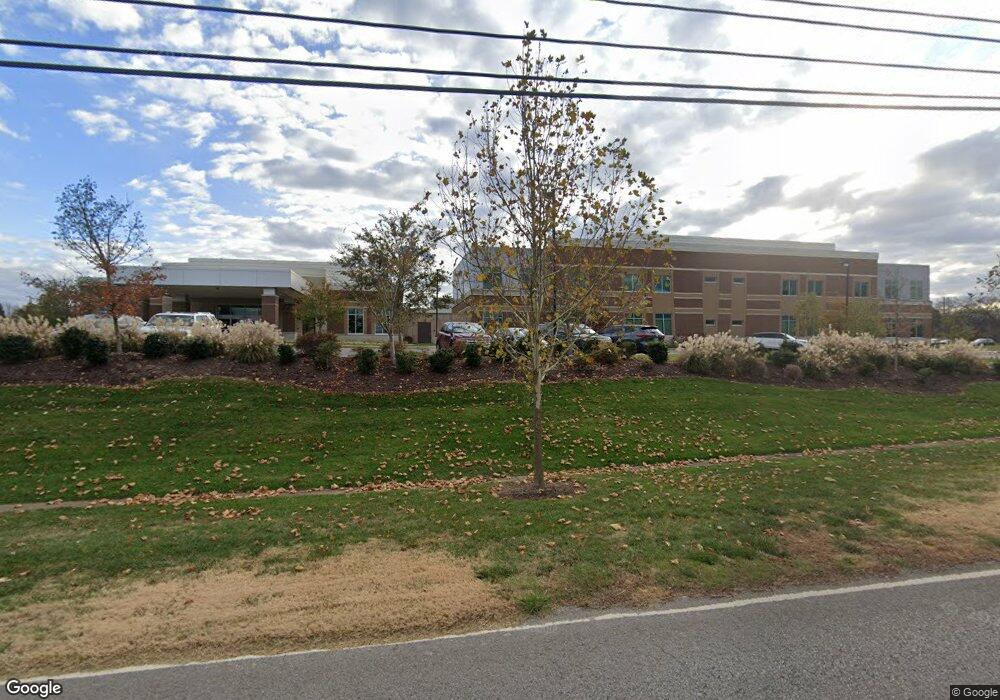
2039 Wilkinson Pike Murfreesboro, TN 37129
Estimated Value: $39,791,332
--
Bed
1
Bath
76,269
Sq Ft
$522/Sq Ft
Est. Value
About This Home
This home is located at 2039 Wilkinson Pike, Murfreesboro, TN 37129 and is currently estimated at $39,791,332, approximately $521 per square foot. 2039 Wilkinson Pike is a home located in Rutherford County with nearby schools including Cason Lane Academy, Brown's Chapel Elementary School, and Blackman Middle School.
Ownership History
Date
Name
Owned For
Owner Type
Purchase Details
Closed on
Jul 8, 2021
Sold by
Trustpoint Hospital Llc
Bought by
Health And Educational Facilities Board Of Ru
Current Estimated Value
Purchase Details
Closed on
Jul 7, 2021
Sold by
Nhi Reit Of Tennessee Llc
Bought by
Trustpoint Hospital Llc
Purchase Details
Closed on
Jul 28, 2017
Sold by
Polaris Hospital Holdings Llc
Bought by
Nhi Reit Of Tennessee Llc
Purchase Details
Closed on
Jun 22, 2016
Sold by
Johnson Fred David
Bought by
Polaris Hospital Holdings Llc
Purchase Details
Closed on
Mar 13, 2006
Sold by
Julia Oliver
Bought by
Elgin Oliver
Create a Home Valuation Report for This Property
The Home Valuation Report is an in-depth analysis detailing your home's value as well as a comparison with similar homes in the area
Home Values in the Area
Average Home Value in this Area
Purchase History
| Date | Buyer | Sale Price | Title Company |
|---|---|---|---|
| Health And Educational Facilities Board Of Ru | -- | None Listed On Document | |
| Trustpoint Hospital Llc | $31,215,265 | None Available | |
| Trustpoint Hospital Llc | $31,215,264 | None Listed On Document | |
| Nhi Reit Of Tennessee Llc | $4,840,000 | None Available | |
| Polaris Hospital Holdings Llc | -- | None Available | |
| Polaris Hospitl Holdings Llc | $1,850,000 | None Available | |
| Elgin Oliver | -- | -- |
Source: Public Records
Tax History Compared to Growth
Tax History
| Year | Tax Paid | Tax Assessment Tax Assessment Total Assessment is a certain percentage of the fair market value that is determined by local assessors to be the total taxable value of land and additions on the property. | Land | Improvement |
|---|---|---|---|---|
| 2025 | -- | $8,633,720 | $877,880 | $7,755,840 |
| 2024 | $244,231 | $8,633,720 | $877,880 | $7,755,840 |
| 2023 | $161,986 | $8,633,720 | $877,880 | $7,755,840 |
| 2022 | $139,538 | $8,633,720 | $877,880 | $7,755,840 |
| 2021 | $128,072 | $5,770,560 | $665,120 | $5,105,440 |
| 2020 | $128,072 | $13,943,680 | $665,120 | $13,278,560 |
| 2019 | $326,925 | $14,730,320 | $1,451,760 | $13,278,560 |
| 2018 | $192,392 | $6,310,400 | $0 | $0 |
| 2017 | $35,593 | $0 | $0 | $0 |
| 2016 | $1,350 | $34,725 | $0 | $0 |
| 2015 | $1,350 | $34,725 | $0 | $0 |
| 2014 | $864 | $34,725 | $0 | $0 |
| 2013 | -- | $45,475 | $0 | $0 |
Source: Public Records
Map
Nearby Homes
- 820 N Thompson Ln Unit 2F
- 820 N Thompson Ln Unit 2A
- 820 N Thompson Ln Unit 4F
- 820 N Thompson Ln Unit 2B
- 820 N Thompson Ln Unit 4E
- 2615 Wilkinson Pike Unit 17A
- 2615 Wilkinson Pike Unit 1404
- 2615 Wilkinson Pike Unit 1402
- 2615 Wilkinson Pike Unit 1405
- 2615 Wilkinson Pike Unit 18A
- 2615 Wilkinson Pike Unit 12A
- 2615 Wilkinson Pike Unit 7A
- 2615 Wilkinson Pike Unit 1008
- 2615 Wilkinson Pike Unit 1103
- 2615 Wilkinson Pike Unit 1101
- 2615 Wilkinson Pike Unit 1105
- 2615 Wilkinson Pike Unit 1203
- 2615 Wilkinson Pike Unit 1306
- 2615 Wilkinson Pike Unit 1303
- 2615 Wilkinson Pike Unit 1006
- 2047 Wilkinson Pike
- 2007 Wilkinson Pike
- 2053 Manson Pike
- 2053 Wilkinson Pike
- 1604 van Cleve Ln
- 2101 Wilkinson Pike
- 1621 van Cleve Ln
- 2107 Wilkinson Pike
- 1605 van Cleve Ln
- 1519 van Cleve Ln
- 1523 van Cleve Ln
- 1515 van Cleve Ln
- 2113 Wilkinson Pike
- 2110 Harding Place
- 1509 van Cleve Ln
- 2119 Wilkinson Pike
- 2116 Harding Place
- 2111 Harding Place
- 1503 van Cleve Ln
- 2122 Harding Place