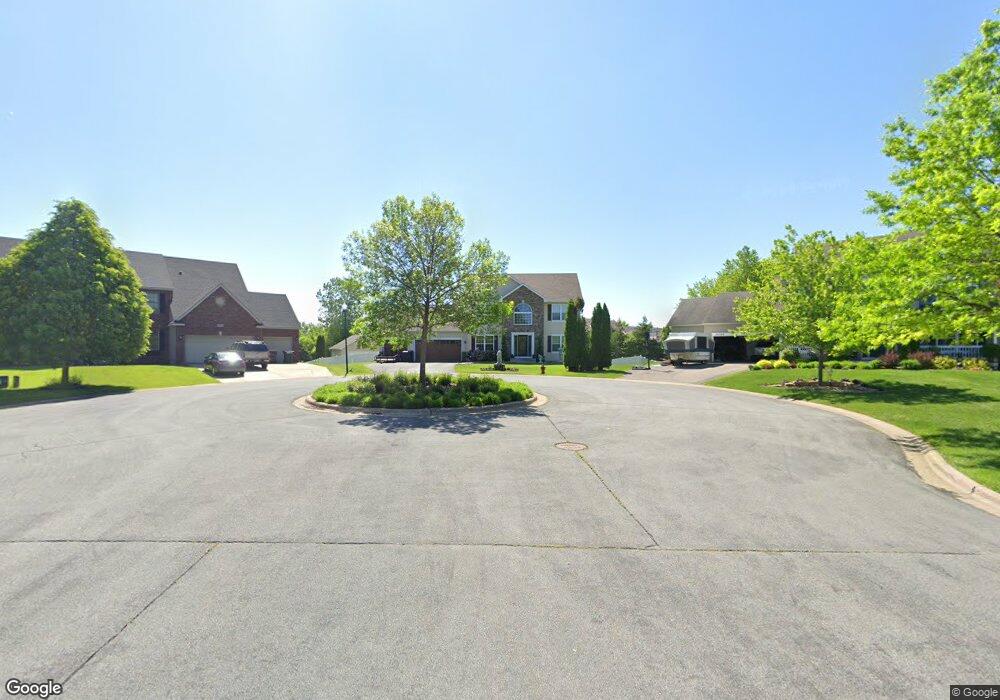
20394 Enright Way Farmington, MN 55024
Estimated Value: $496,738 - $564,000
4
Beds
3
Baths
2,218
Sq Ft
$235/Sq Ft
Est. Value
About This Home
This home is located at 20394 Enright Way, Farmington, MN 55024 and is currently estimated at $520,685, approximately $234 per square foot. 20394 Enright Way is a home located in Dakota County with nearby schools including Riverview Elementary School, Levi P. Dodge Middle School, and Farmington High School.
Ownership History
Date
Name
Owned For
Owner Type
Purchase Details
Closed on
Nov 19, 2009
Sold by
Gaffney John T and Gaffney Carol J
Bought by
Trier Joshua S and Helmboldt Ashley M
Current Estimated Value
Home Financials for this Owner
Home Financials are based on the most recent Mortgage that was taken out on this home.
Original Mortgage
$294,550
Outstanding Balance
$192,821
Interest Rate
5.05%
Mortgage Type
FHA
Estimated Equity
$327,864
Purchase Details
Closed on
Oct 15, 2007
Sold by
Devilliers Anton J and De Villiers Micha J
Bought by
Gaffney John T and Gaffney Carol J
Home Financials for this Owner
Home Financials are based on the most recent Mortgage that was taken out on this home.
Original Mortgage
$274,800
Interest Rate
6.31%
Mortgage Type
New Conventional
Purchase Details
Closed on
Mar 11, 2004
Sold by
D R Horton Inc
Bought by
Devillers Anton J and Devillers Micha J
Create a Home Valuation Report for This Property
The Home Valuation Report is an in-depth analysis detailing your home's value as well as a comparison with similar homes in the area
Home Values in the Area
Average Home Value in this Area
Purchase History
| Date | Buyer | Sale Price | Title Company |
|---|---|---|---|
| Trier Joshua S | $300,000 | -- | |
| Gaffney John T | $343,500 | -- | |
| Devillers Anton J | $351,660 | -- |
Source: Public Records
Mortgage History
| Date | Status | Borrower | Loan Amount |
|---|---|---|---|
| Open | Trier Joshua S | $294,550 | |
| Previous Owner | Gaffney John T | $274,800 |
Source: Public Records
Tax History Compared to Growth
Tax History
| Year | Tax Paid | Tax Assessment Tax Assessment Total Assessment is a certain percentage of the fair market value that is determined by local assessors to be the total taxable value of land and additions on the property. | Land | Improvement |
|---|---|---|---|---|
| 2024 | $5,692 | $457,200 | $129,900 | $327,300 |
| 2023 | $5,692 | $467,400 | $130,100 | $337,300 |
| 2022 | $5,226 | $450,800 | $129,800 | $321,000 |
| 2021 | $5,254 | $369,600 | $111,400 | $258,200 |
| 2020 | $5,112 | $368,700 | $106,100 | $262,600 |
| 2019 | $5,047 | $346,200 | $101,000 | $245,200 |
| 2018 | $4,929 | $335,800 | $96,200 | $239,600 |
| 2017 | $4,651 | $319,000 | $91,600 | $227,400 |
| 2016 | $4,662 | $294,500 | $73,600 | $220,900 |
| 2015 | $4,315 | $275,808 | $68,280 | $207,528 |
| 2014 | -- | $269,050 | $63,385 | $205,665 |
| 2013 | -- | $240,492 | $56,159 | $184,333 |
Source: Public Records
Map
Nearby Homes
- 5305 206th St W Unit 133
- 20514 Erin Ct Unit 15
- 5215 203rd St W
- 20170 Dunbar Ave
- 6586 208th St W
- 6574 208th St W
- 5690 200th St W Unit 202
- 19848 Goldfinch Dr Unit 83
- 19927 Akin Rd
- 19956 Evensong Ave
- 19741 Falcon Path
- 5921 200th St W
- 19622 Escalade Way Unit 1007
- 4797 218th St W
- 19627 Meadowlark Way Unit 133
- 19871 Dover Dr
- 19600 Estes Path
- 5509 Oriole Dr Unit 10
- 5159 216th St W
- 5281 216th St W
- 20390 Enright Way
- 20562 Abbey Ln
- 20562 Abbey Ln Unit 151
- 20398 Enright Way
- 20563 Abbey Ln
- 20564 Abbey Ln
- 20564 Abbey Ln Unit 152
- 20565 Abbey Ln
- 20566 Abbey Ln
- 20567 Abbey Ln
- 20568 Abbey Ln
- 20568 Abbey Ln Unit 154
- 20386 Enright Way
- 20569 Abbey Ln
- 20569 Abbey Ln Unit 155
- 20395 Erickson Path
- 20590 Abbey Ln
- 20587 Abbey Ln
- 20587 Abbey Ln Unit 150
- 20382 Enright Way