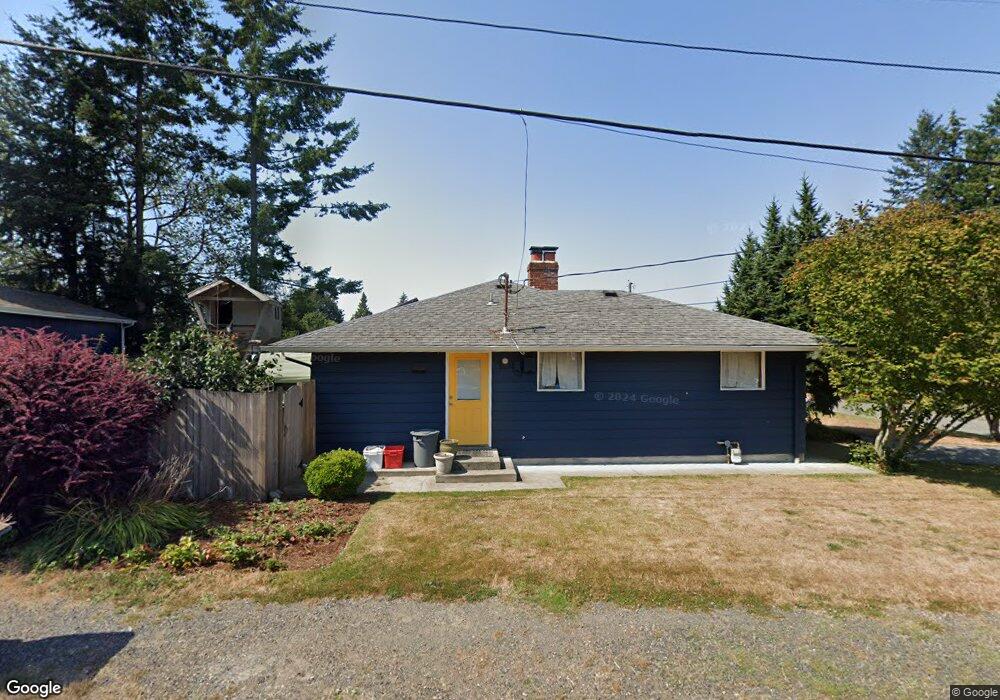
204 48th St SW Everett, WA 98203
View Ridge Madison NeighborhoodEstimated Value: $553,000 - $646,000
3
Beds
1
Bath
1,250
Sq Ft
$486/Sq Ft
Est. Value
About This Home
This home is located at 204 48th St SW, Everett, WA 98203 and is currently estimated at $607,023, approximately $485 per square foot. 204 48th St SW is a home located in Snohomish County with nearby schools including View Ridge Elementary School, Evergreen Middle School, and Everett High School.
Ownership History
Date
Name
Owned For
Owner Type
Purchase Details
Closed on
Mar 12, 2021
Sold by
Dean Cynthia A
Bought by
Dean Cynthia A and Dean Tyler
Current Estimated Value
Home Financials for this Owner
Home Financials are based on the most recent Mortgage that was taken out on this home.
Original Mortgage
$200,000
Outstanding Balance
$179,286
Interest Rate
2.7%
Mortgage Type
New Conventional
Estimated Equity
$427,737
Purchase Details
Closed on
Apr 8, 2014
Sold by
Holmgren Scott W
Bought by
Holmgren Cynthia A
Purchase Details
Closed on
May 1, 2001
Sold by
Stumpf Michele E
Bought by
Holmgren Scott W and Holmgren Cynthia A
Home Financials for this Owner
Home Financials are based on the most recent Mortgage that was taken out on this home.
Original Mortgage
$149,600
Interest Rate
6.89%
Purchase Details
Closed on
Apr 1, 1997
Sold by
Jueidi Mohammad S and Jueidi Dayna R
Bought by
Stumpf Michele E
Home Financials for this Owner
Home Financials are based on the most recent Mortgage that was taken out on this home.
Original Mortgage
$135,992
Interest Rate
7.56%
Mortgage Type
FHA
Create a Home Valuation Report for This Property
The Home Valuation Report is an in-depth analysis detailing your home's value as well as a comparison with similar homes in the area
Home Values in the Area
Average Home Value in this Area
Purchase History
| Date | Buyer | Sale Price | Title Company |
|---|---|---|---|
| Dean Cynthia A | -- | Old Republic Title Ltd | |
| Holmgren Cynthia A | -- | None Available | |
| Holmgren Scott W | $157,500 | -- | |
| Stumpf Michele E | $138,000 | -- |
Source: Public Records
Mortgage History
| Date | Status | Borrower | Loan Amount |
|---|---|---|---|
| Open | Dean Cynthia A | $200,000 | |
| Closed | Holmgren Scott W | $149,600 | |
| Previous Owner | Stumpf Michele E | $135,992 |
Source: Public Records
Tax History Compared to Growth
Tax History
| Year | Tax Paid | Tax Assessment Tax Assessment Total Assessment is a certain percentage of the fair market value that is determined by local assessors to be the total taxable value of land and additions on the property. | Land | Improvement |
|---|---|---|---|---|
| 2025 | $4,393 | $515,300 | $355,000 | $160,300 |
| 2024 | $4,393 | $511,500 | $351,000 | $160,500 |
| 2023 | $4,505 | $548,600 | $356,000 | $192,600 |
| 2022 | $4,229 | $461,900 | $262,000 | $199,900 |
| 2020 | $4,323 | $385,100 | $209,000 | $176,100 |
| 2019 | $4,102 | $367,800 | $201,000 | $166,800 |
| 2018 | $4,007 | $329,300 | $172,000 | $157,300 |
| 2017 | $3,551 | $290,600 | $142,000 | $148,600 |
| 2016 | $2,977 | $256,100 | $118,000 | $138,100 |
| 2015 | $2,737 | $221,800 | $102,000 | $119,800 |
| 2013 | $2,549 | $182,300 | $77,000 | $105,300 |
Source: Public Records
Map
Nearby Homes
- 330 Elm St Unit 305
- 330 Elm St Unit 201
- 520 46th St SE
- 406 Center Place
- 5211 East Dr
- 806 Alpine Dr
- 1014 W Mukilteo Blvd
- 4806 Seahurst Ave
- 1101 W Mukilteo Blvd
- 4529 Crescent Ave
- 5707 East Dr Unit 5 & 6
- 411 58th St SE
- 4417 Crescent Ave
- 5810 Fleming St Unit 92
- 730 53rd St SW
- 605 40th Place
- 1040 N Park Dr
- 5304 Fleming St Unit B
- 1402 51st Place SW
- 5620 Seahurst Ave
- 210 48th St SW
- 220 48th St SW
- 4818 Forest Dr
- 4809 Forest Dr
- 4805 Forest Dr
- 207 49th St SW
- 4803 Forest Dr
- 4813 Forest Dr
- 4718 Forest Dr
- 207 48th St SW
- 222 48th St SW
- 4801 Forest Dr
- 213 49th St SW
- 213 48th St SW
- 4717 Forest Dr
- 219 48th St SW
- 4813 Dogwood Dr
- 4706 Forest Dr
- 4805 Dogwood Dr
- 4801 Dogwood Dr