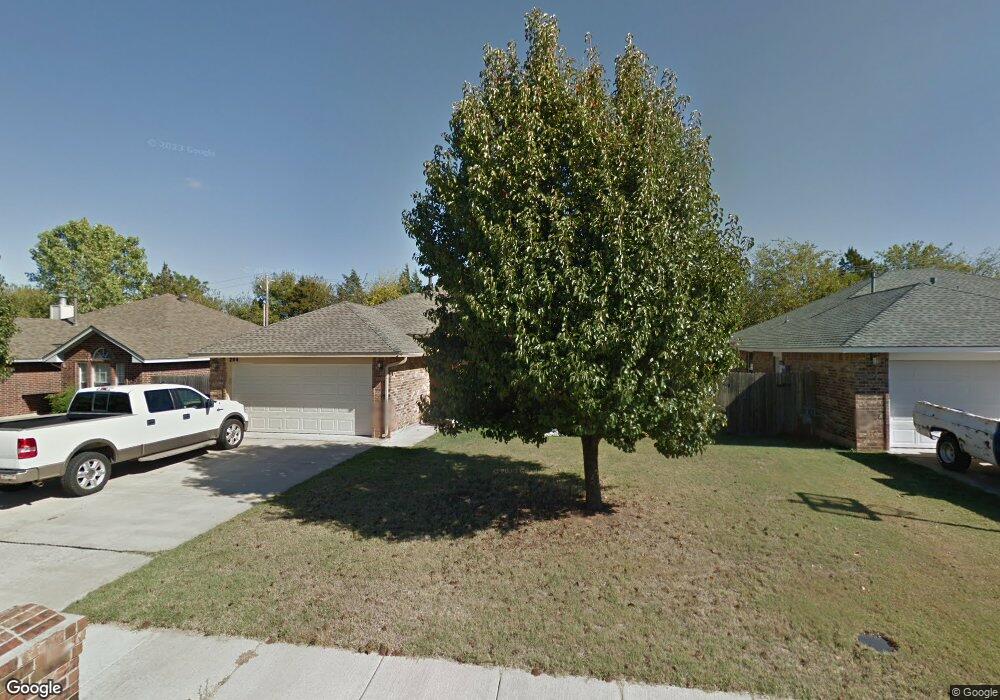
204 Bellgate Dr Yukon, OK 73099
Westgate NeighborhoodEstimated Value: $197,000 - $224,000
3
Beds
2
Baths
1,343
Sq Ft
$156/Sq Ft
Est. Value
About This Home
This home is located at 204 Bellgate Dr, Yukon, OK 73099 and is currently estimated at $209,754, approximately $156 per square foot. 204 Bellgate Dr is a home located in Canadian County with nearby schools including Mustang Creek Elementary School, Meadow Brook Intermediate School, and Mustang Central Middle School.
Ownership History
Date
Name
Owned For
Owner Type
Purchase Details
Closed on
May 12, 2014
Sold by
Threet Jeffrey W and Threet Krystal
Bought by
Owens Troy and Owens Sherry
Current Estimated Value
Purchase Details
Closed on
Nov 17, 2006
Sold by
Walcher Danielle Ruth and Walcher Greg
Bought by
Thrett Jeffrey W
Home Financials for this Owner
Home Financials are based on the most recent Mortgage that was taken out on this home.
Original Mortgage
$117,676
Interest Rate
6.37%
Mortgage Type
VA
Purchase Details
Closed on
Feb 21, 2003
Sold by
United Enterprises Inc
Home Financials for this Owner
Home Financials are based on the most recent Mortgage that was taken out on this home.
Original Mortgage
$91,853
Interest Rate
5.9%
Purchase Details
Closed on
May 8, 2002
Sold by
Erc Land Development Group~Llc
Home Financials for this Owner
Home Financials are based on the most recent Mortgage that was taken out on this home.
Original Mortgage
$192,187
Interest Rate
7.19%
Purchase Details
Closed on
Dec 21, 2000
Sold by
Erc Properties Inc
Create a Home Valuation Report for This Property
The Home Valuation Report is an in-depth analysis detailing your home's value as well as a comparison with similar homes in the area
Home Values in the Area
Average Home Value in this Area
Purchase History
| Date | Buyer | Sale Price | Title Company |
|---|---|---|---|
| Owens Troy | $114,000 | American Eagle Title Group | |
| Thrett Jeffrey W | $86,625 | None Available | |
| -- | $93,000 | -- | |
| -- | $256,500 | -- | |
| -- | -- | -- |
Source: Public Records
Mortgage History
| Date | Status | Borrower | Loan Amount |
|---|---|---|---|
| Previous Owner | Thrett Jeffrey W | $117,676 | |
| Previous Owner | -- | $91,853 | |
| Previous Owner | -- | $192,187 |
Source: Public Records
Tax History Compared to Growth
Tax History
| Year | Tax Paid | Tax Assessment Tax Assessment Total Assessment is a certain percentage of the fair market value that is determined by local assessors to be the total taxable value of land and additions on the property. | Land | Improvement |
|---|---|---|---|---|
| 2024 | $1,919 | $17,793 | $1,890 | $15,903 |
| 2023 | $1,919 | $16,946 | $1,890 | $15,056 |
| 2022 | $1,855 | $16,139 | $1,890 | $14,249 |
| 2021 | $1,760 | $15,370 | $1,890 | $13,480 |
| 2020 | $1,796 | $15,524 | $1,890 | $13,634 |
| 2019 | $1,741 | $15,061 | $1,890 | $13,171 |
| 2018 | $1,688 | $14,344 | $1,890 | $12,454 |
| 2017 | $1,640 | $14,114 | $1,890 | $12,224 |
| 2016 | $1,794 | $15,684 | $1,890 | $13,794 |
| 2015 | $1,711 | $14,743 | $1,890 | $12,853 |
| 2014 | $1,711 | $14,653 | $1,832 | $12,821 |
Source: Public Records
Map
Nearby Homes
- 108 N Eastgate Dr
- 213 Harrogate Dr
- 12320 NW 4th St
- 624 Caladium Dr
- 12517 Park Ave
- 304 Bradgate Dr
- 132 Hickory Hill St
- 209 Bradgate Dr
- 301 Bradgate Dr
- 321 Bradgate Dr
- 121 Pawnee Place
- 12177 Hollyrock Dr
- 212 Sage Brush Rd
- 11817 Hollyrock Dr
- 520 Kearny Ln
- 12113 NW 7th St
- 417 Haven St
- 517 Cherokee Gate Dr
- 12616 NW 1st Terrace
- 429 Haven St
- 208 Bellgate Dr
- 200 Bellgate Dr
- 124 Bellgate Dr
- 205 Bellgate Dr
- 120 Bellgate Dr
- 209 Bellgate Dr
- 201 Bellgate Dr
- 125 Bellgate Dr
- 116 Bellgate Dr
- 121 Bellgate Dr
- 204 N Eastgate Dr
- 200 N Eastgate Dr
- 117 Bellgate Dr
- 112 Bellgate Dr
- 124 N Eastgate Dr
- 113 Bellgate Dr
- 120 N Eastgate Dr
- 108 Bellgate Dr
- 245 N Czech Hall Rd
- 109 Bellgate Dr