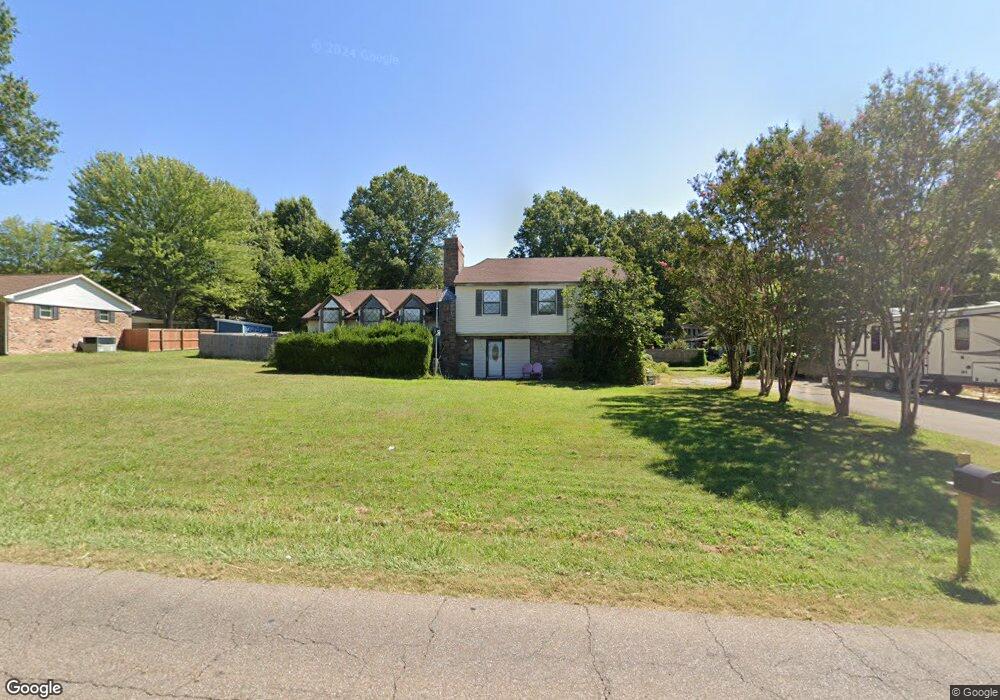
204 Biffle Rd Newbern, TN 38059
Estimated Value: $138,048 - $250,000
--
Bed
3
Baths
2,501
Sq Ft
$76/Sq Ft
Est. Value
About This Home
This home is located at 204 Biffle Rd, Newbern, TN 38059 and is currently estimated at $189,762, approximately $75 per square foot. 204 Biffle Rd is a home located in Dyer County with nearby schools including Newbern Elementary School, Northview Middle School, and Dyer County High School.
Ownership History
Date
Name
Owned For
Owner Type
Purchase Details
Closed on
Jul 14, 2004
Sold by
Household Financial Center
Bought by
Walmsley James E and Walmsley Terry L
Current Estimated Value
Purchase Details
Closed on
Jun 30, 2004
Purchase Details
Closed on
Oct 13, 2003
Sold by
Ashley Randy Sharon
Bought by
Household Financial Center Inc
Purchase Details
Closed on
Oct 31, 1997
Sold by
First Citizens National Ba
Bought by
Ashley Randy Sharon
Home Financials for this Owner
Home Financials are based on the most recent Mortgage that was taken out on this home.
Original Mortgage
$71,000
Interest Rate
7.31%
Purchase Details
Closed on
Jun 16, 1994
Bought by
Peace Bernard C and Lewis Edna J
Purchase Details
Closed on
Dec 20, 1990
Bought by
Lewis Vannie
Purchase Details
Closed on
Oct 6, 1980
Bought by
Kerr Clyde W and Kerr Margaret
Create a Home Valuation Report for This Property
The Home Valuation Report is an in-depth analysis detailing your home's value as well as a comparison with similar homes in the area
Home Values in the Area
Average Home Value in this Area
Purchase History
| Date | Buyer | Sale Price | Title Company |
|---|---|---|---|
| Walmsley James E | $77,900 | -- | |
| Household Financial Center Inc | -- | -- | |
| -- | -- | -- | |
| Household Financial Center Inc | $74,371 | -- | |
| Ashley Randy Sharon | $96,500 | -- | |
| Peace Bernard C | $98,000 | -- | |
| Lewis Vannie | $85,000 | -- | |
| Kerr Clyde W | -- | -- |
Source: Public Records
Mortgage History
| Date | Status | Borrower | Loan Amount |
|---|---|---|---|
| Previous Owner | Kerr Clyde W | $71,000 |
Source: Public Records
Tax History Compared to Growth
Tax History
| Year | Tax Paid | Tax Assessment Tax Assessment Total Assessment is a certain percentage of the fair market value that is determined by local assessors to be the total taxable value of land and additions on the property. | Land | Improvement |
|---|---|---|---|---|
| 2024 | $520 | $21,125 | $2,925 | $18,200 |
| 2023 | $798 | $21,125 | $2,925 | $18,200 |
| 2022 | $779 | $21,125 | $2,925 | $18,200 |
| 2021 | $779 | $21,125 | $2,925 | $18,200 |
| 2020 | $501 | $21,125 | $2,925 | $18,200 |
| 2019 | $858 | $20,750 | $2,925 | $17,825 |
| 2018 | $858 | $20,750 | $2,925 | $17,825 |
| 2017 | $858 | $20,750 | $2,925 | $17,825 |
| 2016 | $862 | $20,750 | $2,925 | $17,825 |
| 2015 | $832 | $20,750 | $2,925 | $17,825 |
| 2014 | $832 | $20,750 | $2,925 | $17,825 |
Source: Public Records
Map
Nearby Homes
- 526 W Main St
- 404 W Main St
- 309 N Grayson St
- 310 N Grayson St
- 322 Flora Cir
- 610 N Grayson St
- 0 Roellen Newbern Rd
- 313 Washington St
- 408 E Main St
- 404 E Johnson St
- 0 N Quincy St
- 908 Granite Dr
- 502 E Johnson St
- 0 Biffle Rd
- 521 E Main St
- 783 Sharps Ferry Rd
- 621 E Main St
- 1585 Sharps Ferry Rd
- 845 W Wind Drive Extension
- 45 Miller St
- 208 Biffle Rd
- 207 Clearview Dr
- 530 Williams St
- 203 Clearview Dr
- 209 Clearview Dr
- 210 Biffle Rd
- 206 Clearview Dr
- 204 Clearview Dr
- 208 Clearview Dr
- 212 Clearview Dr
- 208 Clearview Acres
- 529 Williams St
- 527 Williams St
- 202 Clearview Acres
- 202 Clearview Dr
- 523 Williams St
- 210 Clearview Acres Dr
- 210 Clearview Dr
- 521 Williams St
- 519 Williams St