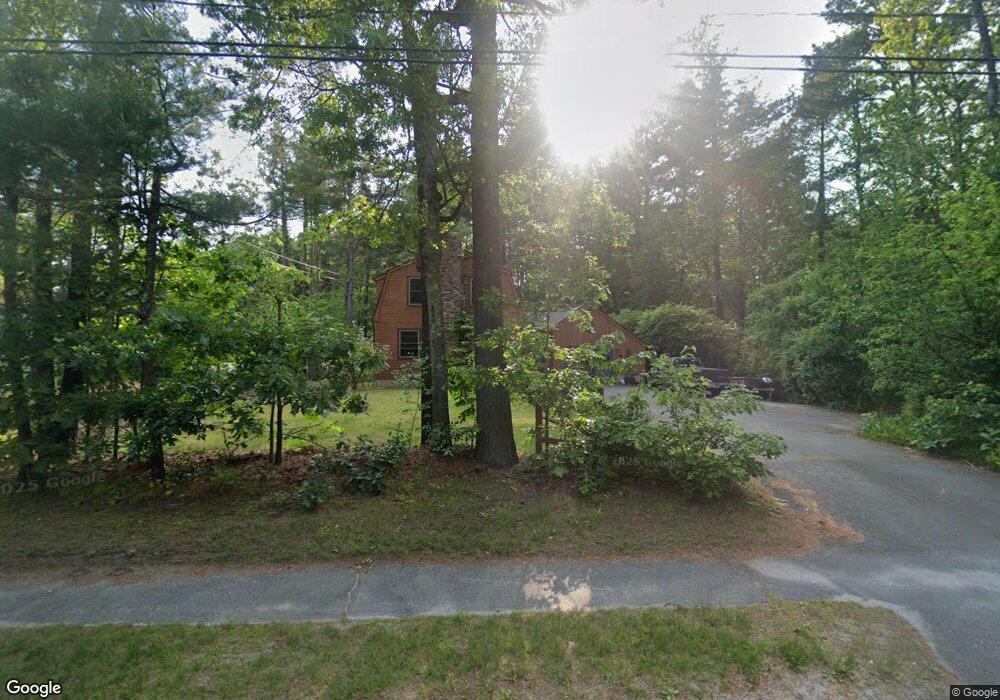
204 County Rd Southampton, MA 01073
Estimated Value: $365,000 - $407,000
3
Beds
2
Baths
1,410
Sq Ft
$280/Sq Ft
Est. Value
About This Home
This home is located at 204 County Rd, Southampton, MA 01073 and is currently estimated at $394,996, approximately $280 per square foot. 204 County Rd is a home located in Hampshire County with nearby schools including William E Norris School, Westfield Christian Academy, and White Oak School.
Ownership History
Date
Name
Owned For
Owner Type
Purchase Details
Closed on
Sep 30, 2005
Sold by
Leach Geoffrey P and Leach Carrie E
Bought by
Drejsa Tomasz and Ras-Drejsa Sabina
Current Estimated Value
Home Financials for this Owner
Home Financials are based on the most recent Mortgage that was taken out on this home.
Original Mortgage
$176,000
Outstanding Balance
$94,678
Interest Rate
5.84%
Mortgage Type
Purchase Money Mortgage
Estimated Equity
$300,318
Purchase Details
Closed on
Nov 16, 2001
Sold by
Rubner Holly A and Rubner Steven E
Bought by
Leach Carrie E and Leach Geoffrey P
Home Financials for this Owner
Home Financials are based on the most recent Mortgage that was taken out on this home.
Original Mortgage
$158,100
Interest Rate
6.7%
Mortgage Type
Purchase Money Mortgage
Purchase Details
Closed on
Feb 21, 1997
Sold by
Lessing Terry J and Rubner Steven E
Bought by
Rubner Holly and Rubner Steven E
Home Financials for this Owner
Home Financials are based on the most recent Mortgage that was taken out on this home.
Original Mortgage
$124,450
Interest Rate
7.8%
Mortgage Type
Purchase Money Mortgage
Create a Home Valuation Report for This Property
The Home Valuation Report is an in-depth analysis detailing your home's value as well as a comparison with similar homes in the area
Home Values in the Area
Average Home Value in this Area
Purchase History
| Date | Buyer | Sale Price | Title Company |
|---|---|---|---|
| Drejsa Tomasz | $220,000 | -- | |
| Leach Carrie E | $155,000 | -- | |
| Rubner Holly | $131,000 | -- |
Source: Public Records
Mortgage History
| Date | Status | Borrower | Loan Amount |
|---|---|---|---|
| Open | Rubner Holly | $105,000 | |
| Open | Drejsa Tomasz | $176,000 | |
| Previous Owner | Rubner Holly | $158,100 | |
| Previous Owner | Rubner Holly | $35,000 | |
| Previous Owner | Rubner Holly | $124,450 |
Source: Public Records
Tax History Compared to Growth
Tax History
| Year | Tax Paid | Tax Assessment Tax Assessment Total Assessment is a certain percentage of the fair market value that is determined by local assessors to be the total taxable value of land and additions on the property. | Land | Improvement |
|---|---|---|---|---|
| 2025 | $4,377 | $308,900 | $83,700 | $225,200 |
| 2024 | $4,255 | $298,600 | $83,700 | $214,900 |
| 2023 | $3,967 | $276,800 | $83,700 | $193,100 |
| 2022 | $3,778 | $250,700 | $75,000 | $175,700 |
| 2021 | $3,491 | $218,600 | $69,000 | $149,600 |
| 2020 | $3,518 | $222,400 | $69,000 | $153,400 |
| 2019 | $3,423 | $209,900 | $69,000 | $140,900 |
| 2018 | $3,234 | $193,400 | $61,800 | $131,600 |
| 2017 | $3,156 | $193,400 | $61,800 | $131,600 |
| 2015 | $2,911 | $185,300 | $56,100 | $129,200 |
Source: Public Records
Map
Nearby Homes
- 4 Fitch Farm Way
- 405 Rock Valley Rd
- 36 County Rd
- Lot 57 White Loaf Rd
- 103 Dupuis Rd
- 94 Pequot Rd (Rear)
- 150 Middle Rd
- 64 Old Stage Rd
- 7 Western View Rd
- 369 College Hwy
- 56 Pomeroy St
- 14 Eastwood Dr
- 59 Campbell Dr
- 0 Char Dr
- 22 Eastwood Ln
- Lot A Homestead Ave
- 33 Maple Crest Cir Unit D
- 15 Maple Crest Cir Unit D
- 34 Maple Crest Cir Unit B
- 6 Emily Ln