Estimated Value: $158,000 - $189,000
3
Beds
1
Bath
1,432
Sq Ft
$123/Sq Ft
Est. Value
About This Home
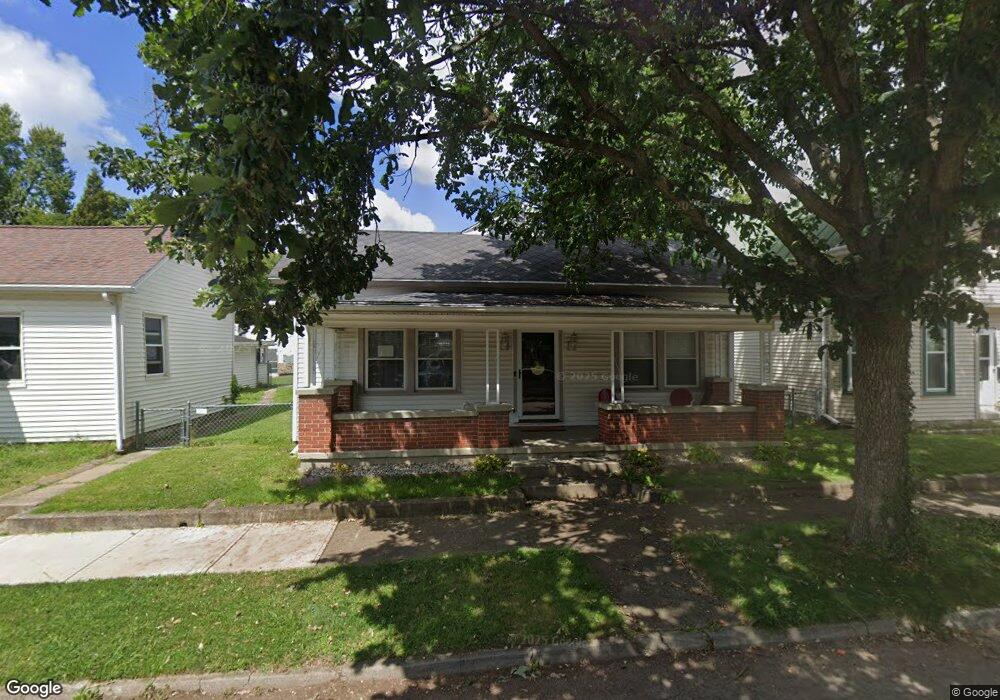
This home is located at 204 Deem St, Eaton, OH 45320 and is currently estimated at $176,446, approximately $123 per square foot. 204 Deem St is a home located in Preble County with nearby schools including Hollingsworth East Elementary School, William Bruce Elementary School, and Eaton Middle School.
Ownership History
Date
Name
Owned For
Owner Type
Purchase Details
Closed on
Sep 15, 2021
Sold by
Wright Kenneth S and Wright Kimberly D
Bought by
Shiverdecker Brandy N
Current Estimated Value
Home Financials for this Owner
Home Financials are based on the most recent Mortgage that was taken out on this home.
Original Mortgage
$142,405
Outstanding Balance
$129,385
Interest Rate
2.7%
Mortgage Type
New Conventional
Estimated Equity
$47,061
Purchase Details
Closed on
Sep 21, 2015
Sold by
Eck Kimberly D and Laws Kimberly D
Bought by
Wright Kenneth S and Laws Kimberly D
Purchase Details
Closed on
Mar 1, 2010
Sold by
Ashworth Patricia A
Bought by
Eck Kimberly D
Purchase Details
Closed on
Sep 9, 1996
Sold by
Jackson Richard L
Bought by
Ashworth Lowell F and Ashworth Patricia A
Home Financials for this Owner
Home Financials are based on the most recent Mortgage that was taken out on this home.
Original Mortgage
$56,000
Interest Rate
8.27%
Mortgage Type
New Conventional
Create a Home Valuation Report for This Property
The Home Valuation Report is an in-depth analysis detailing your home's value as well as a comparison with similar homes in the area
Home Values in the Area
Average Home Value in this Area
Purchase History
| Date | Buyer | Sale Price | Title Company |
|---|---|---|---|
| Shiverdecker Brandy N | $149,900 | Freedom Title Company Inc | |
| Wright Kenneth S | -- | None Available | |
| Eck Kimberly D | -- | Attorney | |
| Ashworth Lowell F | $56,000 | -- |
Source: Public Records
Mortgage History
| Date | Status | Borrower | Loan Amount |
|---|---|---|---|
| Open | Shiverdecker Brandy N | $142,405 | |
| Previous Owner | Ashworth Lowell F | $56,000 |
Source: Public Records
Tax History Compared to Growth
Tax History
| Year | Tax Paid | Tax Assessment Tax Assessment Total Assessment is a certain percentage of the fair market value that is determined by local assessors to be the total taxable value of land and additions on the property. | Land | Improvement |
|---|---|---|---|---|
| 2024 | $1,716 | $48,240 | $5,920 | $42,320 |
| 2023 | $1,716 | $48,240 | $5,920 | $42,320 |
| 2022 | $1,224 | $27,720 | $5,880 | $21,840 |
| 2021 | $1,284 | $27,720 | $5,880 | $21,840 |
| 2020 | $1,237 | $27,720 | $5,880 | $21,840 |
| 2019 | $1,114 | $24,540 | $5,150 | $19,390 |
| 2018 | $1,147 | $24,540 | $5,150 | $19,390 |
| 2017 | $1,048 | $24,540 | $5,150 | $19,390 |
| 2016 | $1,061 | $24,470 | $5,150 | $19,320 |
| 2014 | $1,096 | $24,470 | $5,150 | $19,320 |
| 2013 | $644 | $26,845 | $5,145 | $21,700 |
Source: Public Records
Map
Nearby Homes
- 124 Deem St
- 405 Walnut St
- 111 W High St
- 233 N Barron St
- 0-00 Washington Jackson Rd
- 612 N Cherry St
- 125 E Decatur St
- 219 E High St
- 414 N Maple St
- 210 W Spring St
- 230 W Spring St
- 919 N Barron St
- 331 W Chicago St
- 105 Leatherman Place
- 1008 N Maple St
- 422 Lexington Ave
- 115 Woodland Dr
- 1119 N Maple St
- 117 Vine St
- 301 E Saint Clair St