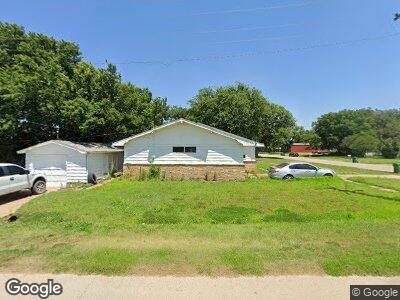
204 E Ash St Pond Creek, OK 73766
Estimated Value: $83,000 - $172,000
2
Beds
1
Bath
1,734
Sq Ft
$65/Sq Ft
Est. Value
About This Home
This home is located at 204 E Ash St, Pond Creek, OK 73766 and is currently estimated at $113,388, approximately $65 per square foot. 204 E Ash St is a home with nearby schools including Pond Creek-Hunter Elementary School and Pond Creek-Hunter High School.
Ownership History
Date
Name
Owned For
Owner Type
Purchase Details
Closed on
May 24, 2022
Sold by
Michael Vanhalcomb
Bought by
Regier Ronald Edward and Regier Sandra A
Current Estimated Value
Home Financials for this Owner
Home Financials are based on the most recent Mortgage that was taken out on this home.
Original Mortgage
$72,000
Interest Rate
5.25%
Mortgage Type
New Conventional
Purchase Details
Closed on
May 21, 2022
Sold by
Bradbury and Colin
Bought by
Regier Ronald Edward and Regier Sandra A
Home Financials for this Owner
Home Financials are based on the most recent Mortgage that was taken out on this home.
Original Mortgage
$72,000
Interest Rate
5.25%
Mortgage Type
New Conventional
Purchase Details
Closed on
Oct 25, 2010
Sold by
League Kent M
Bought by
Halcomb Mchael V
Purchase Details
Closed on
Dec 18, 2004
Sold by
Hess Edgar E and Hess Sherry
Bought by
Hess Allen B
Purchase Details
Closed on
Dec 10, 1995
Sold by
Rue Anna Smith, Trustee
Bought by
Kent M. League, Trustee
Create a Home Valuation Report for This Property
The Home Valuation Report is an in-depth analysis detailing your home's value as well as a comparison with similar homes in the area
Home Values in the Area
Average Home Value in this Area
Purchase History
| Date | Buyer | Sale Price | Title Company |
|---|---|---|---|
| Regier Ronald Edward | $18,000 | None Listed On Document | |
| Regier Ronald Edward | -- | None Listed On Document | |
| Halcomb Mchael V | $41,500 | None Available | |
| Kent M. League, Trustee | $18,000 | -- |
Source: Public Records
Mortgage History
| Date | Status | Borrower | Loan Amount |
|---|---|---|---|
| Previous Owner | Berg Larry | $72,000 |
Source: Public Records
Tax History Compared to Growth
Tax History
| Year | Tax Paid | Tax Assessment Tax Assessment Total Assessment is a certain percentage of the fair market value that is determined by local assessors to be the total taxable value of land and additions on the property. | Land | Improvement |
|---|---|---|---|---|
| 2024 | $1,035 | $13,632 | $338 | $13,294 |
| 2023 | $1,028 | $12,982 | $338 | $12,644 |
| 2022 | $577 | $7,456 | $338 | $7,118 |
| 2021 | $521 | $7,101 | $338 | $6,763 |
| 2020 | $484 | $6,881 | $338 | $6,543 |
| 2019 | $478 | $6,553 | $338 | $6,215 |
| 2018 | $415 | $6,241 | $338 | $5,903 |
| 2017 | $377 | $5,663 | $338 | $5,325 |
| 2016 | $445 | $6,412 | $292 | $6,120 |
| 2015 | $422 | $6,107 | $266 | $5,841 |
| 2014 | $401 | $5,816 | $244 | $5,572 |
Source: Public Records
Map
Nearby Homes
- 308 N Biloxi
- 315 Biloxi St
- 411 E Riverview Dr
- 725 W Ash St
- 519 S Apache
- 431 E Aspen Ave
- 0 W Broadway and W Ash Ave Unit 20250093
- 0100 E 0190 (Grant) Rd
- 000 N2900 Rd
- 0 N 54th St Unit 20231110
- 80 E Blaine Rd
- 204 S Park St
- 412 E Cherokee St
- 218 E Kiowa
- 000 Jefferson Rd
- 10602 Prairie Rose Ln
- 930 Bryan Dr
- 000 Johnston Rd
- Haskell and Cr950
- 2 Northview Rd