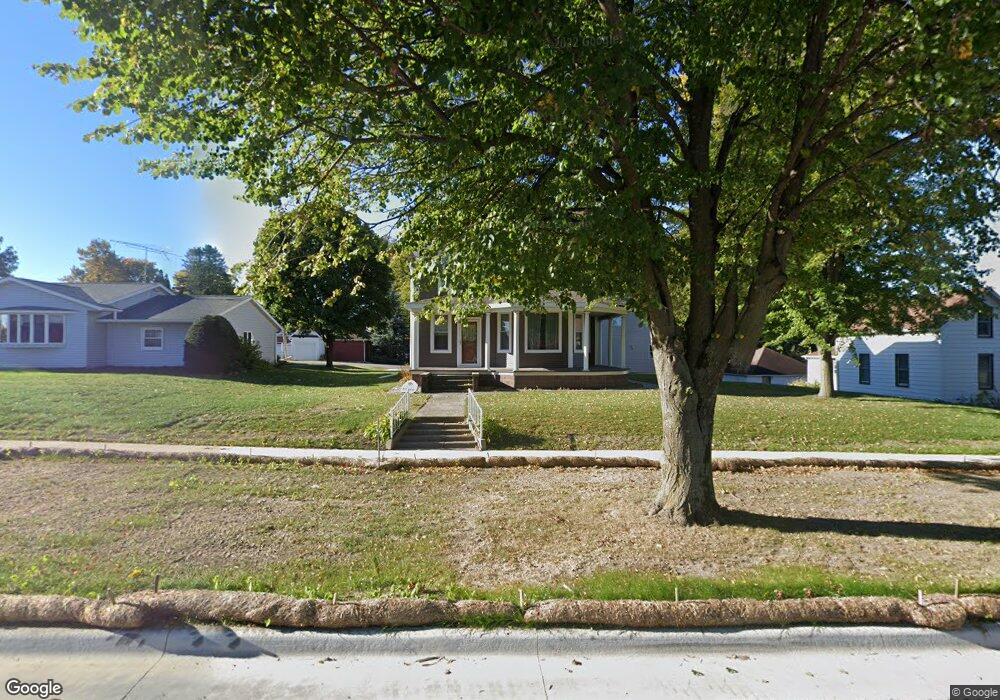
204 E Main St Ossian, IA 52161
Estimated Value: $229,000 - $254,000
3
Beds
2
Baths
2,140
Sq Ft
$115/Sq Ft
Est. Value
About This Home
This home is located at 204 E Main St, Ossian, IA 52161 and is currently estimated at $246,811, approximately $115 per square foot. 204 E Main St is a home located in Winneshiek County with nearby schools including South Winneshiek Elementary School, South Winneshiek Middle School, and South Winneshiek High School.
Ownership History
Date
Name
Owned For
Owner Type
Purchase Details
Closed on
Apr 5, 2021
Sold by
Bohr Justin C and Bohr Abbie L
Bought by
Bohr Justin C and Bohr Abbie L
Current Estimated Value
Home Financials for this Owner
Home Financials are based on the most recent Mortgage that was taken out on this home.
Original Mortgage
$89,611
Outstanding Balance
$65,890
Interest Rate
2.3%
Mortgage Type
New Conventional
Estimated Equity
$180,921
Purchase Details
Closed on
Aug 30, 2012
Sold by
Hertges Bradley A and Hertges Karen V
Bought by
Bohr Justin C
Home Financials for this Owner
Home Financials are based on the most recent Mortgage that was taken out on this home.
Original Mortgage
$14,000
Interest Rate
3.52%
Mortgage Type
FHA
Create a Home Valuation Report for This Property
The Home Valuation Report is an in-depth analysis detailing your home's value as well as a comparison with similar homes in the area
Purchase History
| Date | Buyer | Sale Price | Title Company |
|---|---|---|---|
| Bohr Justin C | -- | None Listed On Document | |
| Bohr Justin C | -- | None Available | |
| Bohr Justin C | $140,000 | None Available |
Source: Public Records
Mortgage History
| Date | Status | Borrower | Loan Amount |
|---|---|---|---|
| Open | Bohr Justin C | $89,611 | |
| Previous Owner | Bohr Justin C | $14,000 |
Source: Public Records
Tax History
| Year | Tax Paid | Tax Assessment Tax Assessment Total Assessment is a certain percentage of the fair market value that is determined by local assessors to be the total taxable value of land and additions on the property. | Land | Improvement |
|---|---|---|---|---|
| 2025 | $3,622 | $246,370 | $18,360 | $228,010 |
| 2024 | $3,622 | $216,100 | $18,360 | $197,740 |
| 2023 | $3,408 | $216,100 | $18,360 | $197,740 |
| 2022 | $3,170 | $187,530 | $15,300 | $172,230 |
| 2021 | $3,066 | $179,900 | $15,300 | $164,600 |
| 2020 | $3,066 | $168,660 | $15,300 | $153,360 |
| 2019 | $3,062 | $168,660 | $0 | $0 |
| 2018 | $2,974 | $168,660 | $0 | $0 |
| 2017 | $2,344 | $130,780 | $0 | $0 |
| 2016 | $2,260 | $130,780 | $0 | $0 |
| 2015 | $2,212 | $126,430 | $0 | $0 |
| 2014 | $2,152 | $126,430 | $0 | $0 |
Source: Public Records
Map
Nearby Homes
- 421 E Main St
- 209 Jessie St
- 211 Fisher Ave
- 1623 W42
- 1627 W42
- 1796 Middle Ossian Rd
- 0 Lake Ridge Rd
- 1774 Peppy Place Rd
- 112 Merrill Rd
- 203 N Iowa St
- 206 E Clark St
- 401 S Maryville St
- 413 N Jefferson St
- 204 Railroad St
- 302 S West St
- 407 W North St
- 12546 Main St
- 1129 164th St
- 28882 Pine St
- 2514 175th St
Your Personal Tour Guide
Ask me questions while you tour the home.