204 Elm St Broken Bow, OK 74728
Estimated Value: $203,000 - $372,000
3
Beds
2
Baths
1,758
Sq Ft
$150/Sq Ft
Est. Value
About This Home
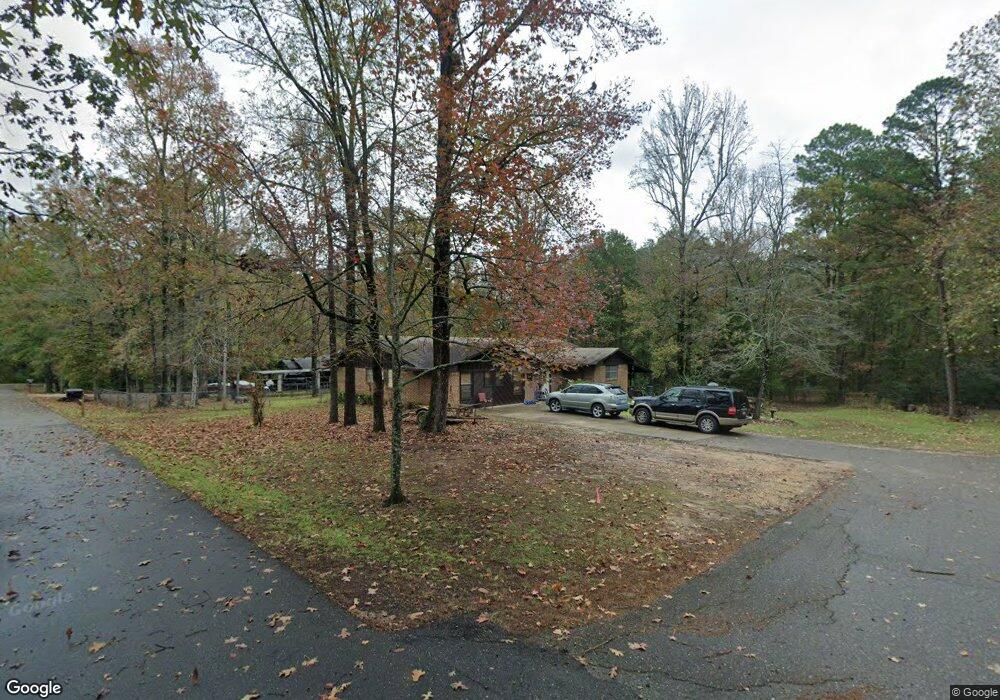
This home is located at 204 Elm St, Broken Bow, OK 74728 and is currently estimated at $263,618, approximately $149 per square foot. 204 Elm St is a home located in McCurtain County with nearby schools including Dierks Elementary School, Bennett Elementary School, and Rector Johnson Middle School.
Ownership History
Date
Name
Owned For
Owner Type
Purchase Details
Closed on
Jan 16, 2018
Sold by
Blankenship Wenda M and Blankenship Lewis S
Bought by
Ridenour Daniel W and Ridenour Linda D
Current Estimated Value
Home Financials for this Owner
Home Financials are based on the most recent Mortgage that was taken out on this home.
Original Mortgage
$121,078
Outstanding Balance
$84,549
Interest Rate
3.94%
Mortgage Type
Commercial
Estimated Equity
$179,069
Purchase Details
Closed on
Mar 20, 2013
Sold by
Kress Ralph J and Kress Jacqueline M
Bought by
Blankenship Wenda M and Kress Conrad F
Create a Home Valuation Report for This Property
The Home Valuation Report is an in-depth analysis detailing your home's value as well as a comparison with similar homes in the area
Home Values in the Area
Average Home Value in this Area
Purchase History
| Date | Buyer | Sale Price | Title Company |
|---|---|---|---|
| Ridenour Daniel W | $118,000 | None Available | |
| Blankenship Wenda M | -- | None Available |
Source: Public Records
Mortgage History
| Date | Status | Borrower | Loan Amount |
|---|---|---|---|
| Open | Ridenour Daniel W | $121,078 |
Source: Public Records
Tax History Compared to Growth
Tax History
| Year | Tax Paid | Tax Assessment Tax Assessment Total Assessment is a certain percentage of the fair market value that is determined by local assessors to be the total taxable value of land and additions on the property. | Land | Improvement |
|---|---|---|---|---|
| 2025 | $918 | $12,369 | $1,275 | $11,094 |
| 2024 | $918 | $12,009 | $1,238 | $10,771 |
| 2023 | $902 | $12,009 | $1,238 | $10,771 |
| 2022 | $930 | $12,342 | $1,238 | $11,104 |
| 2021 | $914 | $12,342 | $1,238 | $11,104 |
| 2020 | $956 | $12,766 | $1,238 | $11,528 |
| 2019 | $978 | $12,980 | $1,238 | $11,742 |
| 2018 | $573 | $7,944 | $1,114 | $6,830 |
| 2017 | $630 | $7,566 | $1,040 | $6,526 |
| 2016 | $604 | $7,205 | $337 | $6,868 |
| 2015 | $618 | $7,205 | $337 | $6,868 |
| 2014 | $622 | $7,205 | $337 | $6,868 |
Source: Public Records
Map
Nearby Homes
- 284 Red Berry Trail
- 104 Cedar Bluff Trail
- 334 Bent Oak Trail
- 300 Bent Oak Trail
- 908 Circle Dr
- 59 Pine St
- 136 Preserve Way
- 183 Preserve Way
- 612 W Circle Dr
- 86 Preserve Way
- 87 Preserve Way
- 688 Long Pine Trail
- 875 N Lukfata Trail Rd
- 229 Sweet Gum Trail
- 299 Sugarberry Trail
- 40 Preserve Way
- 63 Loblolly Springs Trail
- 99 Hickory Springs Trail
- 44 Blue Ivy Cir
- 189 Sweet Gum Trail