204 Gold Run Rd Boulder, CO 80302
Estimated Value: $517,000 - $834,550
3
Beds
2
Baths
1,668
Sq Ft
$419/Sq Ft
Est. Value
About This Home
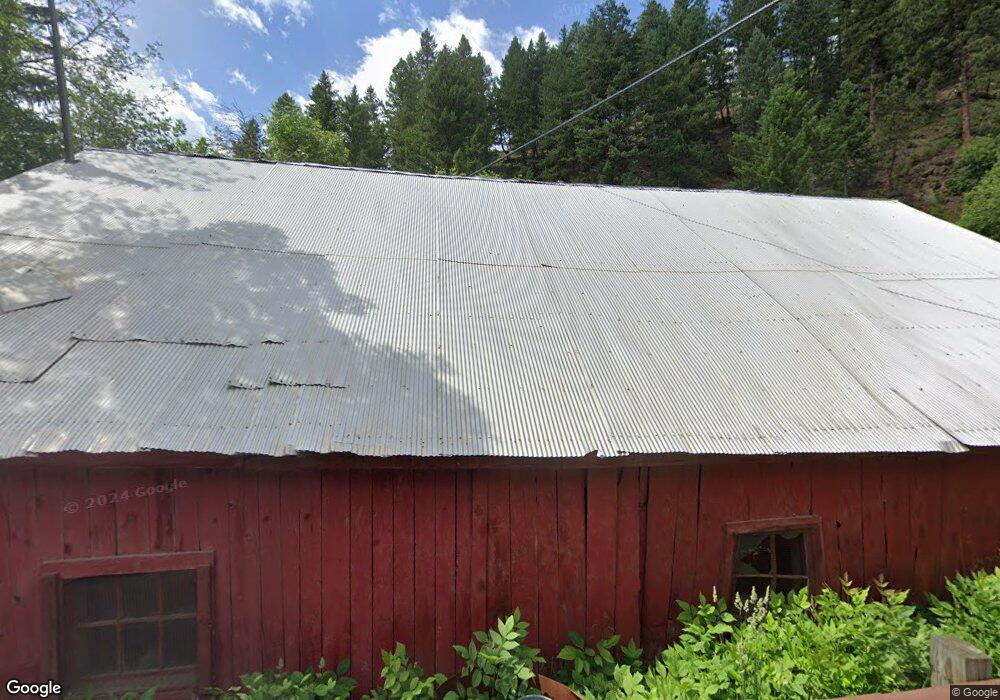
This home is located at 204 Gold Run Rd, Boulder, CO 80302 and is currently estimated at $699,388, approximately $419 per square foot. 204 Gold Run Rd is a home located in Boulder County with nearby schools including Flatirons Elementary School, Casey Middle School, and Boulder High School.
Ownership History
Date
Name
Owned For
Owner Type
Purchase Details
Closed on
Sep 19, 2019
Sold by
Krajicek Christopher M and Krajicek Claudia
Bought by
Krajicek Christopher M
Current Estimated Value
Home Financials for this Owner
Home Financials are based on the most recent Mortgage that was taken out on this home.
Original Mortgage
$280,495
Outstanding Balance
$245,692
Interest Rate
3.6%
Mortgage Type
New Conventional
Estimated Equity
$453,696
Purchase Details
Closed on
Jun 17, 2015
Sold by
Lawrence Robert S
Bought by
Krajicek Christopher M
Home Financials for this Owner
Home Financials are based on the most recent Mortgage that was taken out on this home.
Original Mortgage
$193,920
Interest Rate
3.9%
Mortgage Type
New Conventional
Purchase Details
Closed on
Oct 14, 1980
Bought by
Krajicek Christopher and Krajicek Claudia
Create a Home Valuation Report for This Property
The Home Valuation Report is an in-depth analysis detailing your home's value as well as a comparison with similar homes in the area
Purchase History
| Date | Buyer | Sale Price | Title Company |
|---|---|---|---|
| Krajicek Christopher M | -- | None Available | |
| Krajicek Christopher M | $242,400 | Land Title Guarantee Company | |
| Krajicek Christopher | -- | -- |
Source: Public Records
Mortgage History
| Date | Status | Borrower | Loan Amount |
|---|---|---|---|
| Open | Krajicek Christopher M | $280,495 | |
| Closed | Krajicek Christopher M | $193,920 |
Source: Public Records
Tax History
| Year | Tax Paid | Tax Assessment Tax Assessment Total Assessment is a certain percentage of the fair market value that is determined by local assessors to be the total taxable value of land and additions on the property. | Land | Improvement |
|---|---|---|---|---|
| 2025 | $3,326 | $37,769 | $8,569 | $29,200 |
| 2024 | $3,326 | $37,769 | $8,569 | $29,200 |
| 2023 | $3,274 | $34,244 | $10,117 | $27,812 |
| 2022 | $3,062 | $29,981 | $6,964 | $23,017 |
| 2021 | $2,930 | $30,842 | $7,164 | $23,678 |
| 2020 | $2,507 | $26,127 | $6,078 | $20,049 |
| 2019 | $2,472 | $26,127 | $6,078 | $20,049 |
| 2018 | $1,486 | $15,509 | $5,184 | $10,325 |
| 2017 | $1,447 | $17,146 | $5,731 | $11,415 |
| 2016 | $1,231 | $12,832 | $4,338 | $8,494 |
| 2015 | $1,032 | $11,773 | $3,980 | $7,793 |
| 2014 | -- | $15,013 | $5,073 | $9,940 |
Source: Public Records
Map
Nearby Homes
- 6415 Sunshine Canyon Dr
- 560 Wild Turkey Trail Unit 38
- 6801 Sunshine Canyon Dr
- 6112 Fourmile Canyon Dr
- 6122 Fourmile Canyon Dr
- 5554 Sunshine Canyon Dr
- 1000 Alaska Rd
- 375 Arroyo Chico
- 61 Rim Rd
- 6055 Fourmile Canyon Dr
- 7893 Fourmile Canyon Dr
- 300 Shining Star Trail
- 300 Shining Star Trail Unit A
- 718 Emerson Gulch Rd
- 00 County Rd 89 Unit 237
- 2050 Fourmile Canyon Dr
- 208 Wild Tiger Rd
- 1327 Weaver Dr
- 5567 Lefthand Canyon Dr
- 397 Glendale Gulch Rd
- 217 Gold Run Rd
- 219 Gold Run Rd
- 363 Gold Run Rd
- 363 Gold Run Rd Unit & 365
- 175 Gold Run Rd
- 223 Gold Run Rd
- 270 Gold Run Rd
- 173 Gold Run Rd
- 4900 Fourmile Canyon Dr
- 4850 Fourmile Canyon Dr
- 300 Gold Run Rd
- 4950 Fourmile Canyon Dr
- 315 Gold Run Rd
- 17 Gold Run Rd
- 321 Gold Run Rd
- 84 Gold Run Rd
- 0 Gold Run Rd
- 5008 Fourmile Canyon Dr
- 365 Gold Run Rd
- 386 Gold Run Rd
Your Personal Tour Guide
Ask me questions while you tour the home.