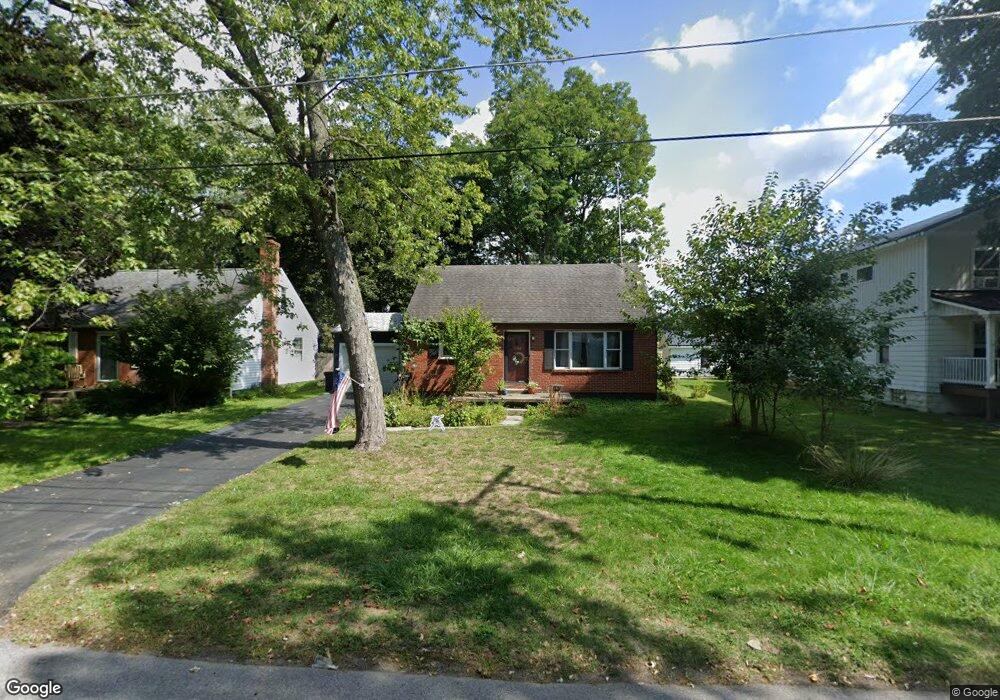
204 Hamlin Ave East Aurora, NY 14052
Estimated Value: $327,000 - $381,000
3
Beds
1
Bath
1,248
Sq Ft
$281/Sq Ft
Est. Value
About This Home
This home is located at 204 Hamlin Ave, East Aurora, NY 14052 and is currently estimated at $350,644, approximately $280 per square foot. 204 Hamlin Ave is a home located in Erie County with nearby schools including Parkdale Elementary School, East Aurora Middle School, and East Aurora High School.
Ownership History
Date
Name
Owned For
Owner Type
Purchase Details
Closed on
Jun 17, 2010
Sold by
Sterlace Christopher and Sterlace Anna
Bought by
Hansen Adam B and Hansen Sarah E
Current Estimated Value
Home Financials for this Owner
Home Financials are based on the most recent Mortgage that was taken out on this home.
Original Mortgage
$147,020
Outstanding Balance
$99,877
Interest Rate
5.25%
Mortgage Type
FHA
Estimated Equity
$250,767
Purchase Details
Closed on
Dec 1, 2005
Sold by
Relative Restoration Llc
Bought by
Sterlace Christopher and Sterlace Anna
Purchase Details
Closed on
Sep 28, 2004
Sold by
Sirva Relocation Llc
Bought by
Relative Restoration Llc
Purchase Details
Closed on
Sep 24, 2004
Sold by
Miller Thomas J
Bought by
Sirva Relocation Llc
Purchase Details
Closed on
May 18, 1999
Sold by
Cameron George W and Cameron Carol C
Bought by
Miller Thomas J
Create a Home Valuation Report for This Property
The Home Valuation Report is an in-depth analysis detailing your home's value as well as a comparison with similar homes in the area
Home Values in the Area
Average Home Value in this Area
Purchase History
| Date | Buyer | Sale Price | Title Company |
|---|---|---|---|
| Hansen Adam B | $149,000 | Ticor Title Insurance Co | |
| Sterlace Christopher | $130,000 | None Available | |
| Relative Restoration Llc | $113,500 | -- | |
| Sirva Relocation Llc | $113,500 | -- | |
| Miller Thomas J | $86,700 | -- |
Source: Public Records
Mortgage History
| Date | Status | Borrower | Loan Amount |
|---|---|---|---|
| Open | Hansen Adam B | $147,020 |
Source: Public Records
Tax History Compared to Growth
Tax History
| Year | Tax Paid | Tax Assessment Tax Assessment Total Assessment is a certain percentage of the fair market value that is determined by local assessors to be the total taxable value of land and additions on the property. | Land | Improvement |
|---|---|---|---|---|
| 2024 | -- | $58,200 | $5,500 | $52,700 |
| 2023 | $6,160 | $58,200 | $5,500 | $52,700 |
| 2022 | $5,574 | $58,200 | $5,500 | $52,700 |
| 2021 | $4,310 | $58,200 | $5,500 | $52,700 |
| 2020 | $4,396 | $58,200 | $5,500 | $52,700 |
| 2019 | $4,121 | $58,200 | $5,500 | $52,700 |
| 2018 | $4,587 | $58,200 | $5,500 | $52,700 |
| 2017 | $1,357 | $58,200 | $5,500 | $52,700 |
| 2016 | $4,272 | $58,200 | $5,500 | $52,700 |
| 2015 | -- | $58,200 | $5,500 | $52,700 |
| 2014 | -- | $58,200 | $5,500 | $52,700 |
Source: Public Records
Map
Nearby Homes
- 11 Beechwood Dr
- 116 Hamlin Ave
- 36 Hillcrest Rd
- 35 Hamlin Ave
- 270 Buffalo Rd Unit 4
- 270 Buffalo Rd Unit 60
- 46 Bowen Rd
- 216 Roycroft Cir
- 223 Greenwood Dr
- 529 Ridge Ave
- 22 Highland Dr
- 51 Paine St
- 1823 Center St
- 7 Woodbrook Dr Unit 3
- 4050 Martingale Ct
- 4650 Martingale Ct
- 57 Savage Place
- 584 Oakwood Ave
- 245 Sycamore St
- 132 Beech Rd