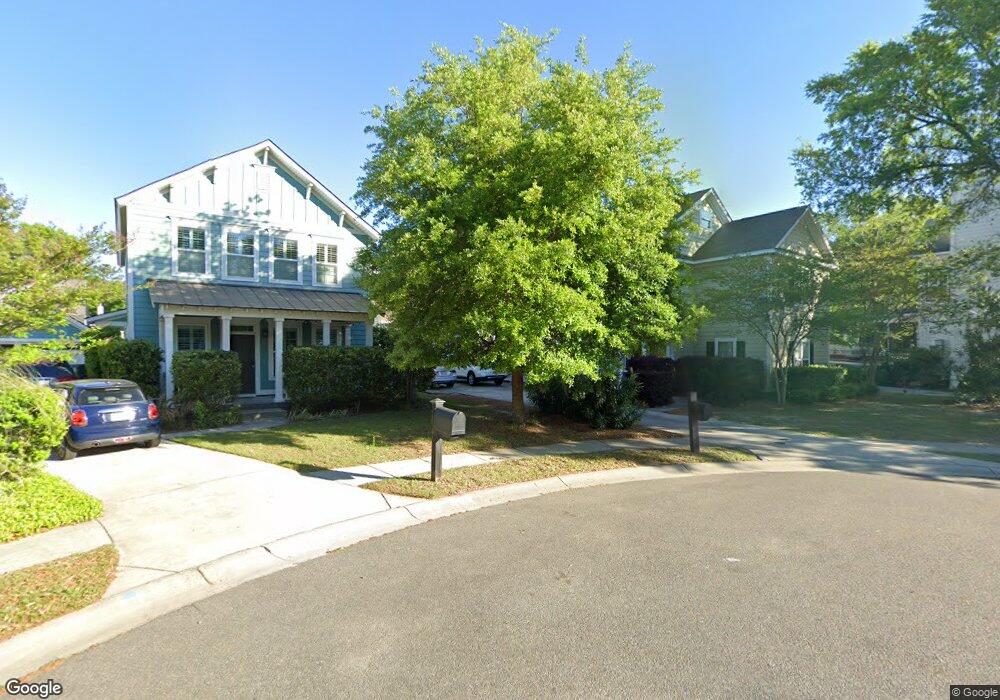
204 Hasell Ct Wando, SC 29492
Wando NeighborhoodEstimated Value: $637,000 - $811,000
5
Beds
4
Baths
3,200
Sq Ft
$235/Sq Ft
Est. Value
About This Home
This home is located at 204 Hasell Ct, Wando, SC 29492 and is currently estimated at $751,796, approximately $234 per square foot. 204 Hasell Ct is a home located in Berkeley County with nearby schools including Bishop England High School.
Ownership History
Date
Name
Owned For
Owner Type
Purchase Details
Closed on
Dec 14, 2012
Sold by
Rmk Bruza Llc
Bought by
Robinson David E and Bachmann Teri L
Current Estimated Value
Home Financials for this Owner
Home Financials are based on the most recent Mortgage that was taken out on this home.
Original Mortgage
$326,500
Outstanding Balance
$226,318
Interest Rate
3.38%
Mortgage Type
New Conventional
Estimated Equity
$525,478
Purchase Details
Closed on
Apr 10, 2012
Sold by
Winsor Asset Management Llc
Bought by
Rmk Bruza Llc
Purchase Details
Closed on
Dec 8, 2009
Sold by
Wachovia Bank National Association
Bought by
Winsor Asset Management Llc
Purchase Details
Closed on
Sep 15, 2008
Sold by
Meridian Builders Inc
Bought by
Wachovia Bank Na
Purchase Details
Closed on
Aug 4, 2006
Sold by
53 Hasell Llc
Bought by
Meridian Builders Inc
Home Financials for this Owner
Home Financials are based on the most recent Mortgage that was taken out on this home.
Original Mortgage
$6,000,000
Interest Rate
6.71%
Mortgage Type
New Conventional
Create a Home Valuation Report for This Property
The Home Valuation Report is an in-depth analysis detailing your home's value as well as a comparison with similar homes in the area
Home Values in the Area
Average Home Value in this Area
Purchase History
| Date | Buyer | Sale Price | Title Company |
|---|---|---|---|
| Robinson David E | $326,500 | -- | |
| Rmk Bruza Llc | $50,000 | -- | |
| Winsor Asset Management Llc | $102,000 | -- | |
| Wachovia Bank Na | $510,000 | -- | |
| Meridian Builders Inc | $2,702,337 | None Available |
Source: Public Records
Mortgage History
| Date | Status | Borrower | Loan Amount |
|---|---|---|---|
| Open | Robinson David E | $326,500 | |
| Previous Owner | Meridian Builders Inc | $6,000,000 |
Source: Public Records
Tax History Compared to Growth
Tax History
| Year | Tax Paid | Tax Assessment Tax Assessment Total Assessment is a certain percentage of the fair market value that is determined by local assessors to be the total taxable value of land and additions on the property. | Land | Improvement |
|---|---|---|---|---|
| 2025 | $1,569 | $363,159 | $82,209 | $280,950 |
| 2024 | $1,569 | $14,526 | $3,288 | $11,238 |
| 2023 | $1,569 | $14,526 | $3,288 | $11,238 |
| 2022 | $1,571 | $12,631 | $2,605 | $10,026 |
| 2021 | $1,611 | $12,640 | $2,605 | $10,026 |
| 2020 | $1,631 | $12,631 | $2,605 | $10,026 |
| 2019 | $1,620 | $12,631 | $2,605 | $10,026 |
| 2018 | $1,486 | $10,984 | $1,800 | $9,184 |
| 2017 | $1,337 | $10,984 | $1,800 | $9,184 |
| 2016 | $1,371 | $10,980 | $1,800 | $9,180 |
| 2015 | $1,258 | $10,980 | $1,800 | $9,180 |
| 2014 | $1,240 | $10,980 | $1,800 | $9,180 |
| 2013 | -- | $10,980 | $1,800 | $9,180 |
Source: Public Records
Map
Nearby Homes
- 522 Tayrn Dr
- 237 Kelsey Blvd
- 224 Kelsey Blvd
- 255 Kelsey Blvd
- 263 Kelsey Blvd
- 565 Tayrn Dr
- 100 Tidewater Way
- 402 Topsail Ct
- 102 Tidewater Way
- 105 Tidewater Way
- 104 Tidewater Way
- 107 Tidewater Way
- 109 Tidewater Way
- 111 Tidewater Way
- 312 Kelsey Blvd
- 492 Sanders Farm Ln
- 330 Kelsey Blvd
- 433 Doane Way
- 112 Rowans Creek Dr
- 672 Barbados Dr
- 204 Hasell Ct
- 202 Hasell Ct
- 206 Hasell Ct
- 208 Hasell Ct
- 107 Franklin Retreat Ct
- 0 Hasell Ct Unit B 2015147
- 111 Franklin Retreat Ct
- 0 Hasell Ct
- 103 Franklin Retreat Ct
- 128 Country Oaks Ln
- 126 Country Oaks Ln
- 205 Hasell Ct
- 113 Franklin Retreat Ct
- 207 Hasell Ct
- 203 Hasell Ct
- 130 Country Oaks Ln
- 124 Country Oaks Ln
- 418 Sanders Farm Ln
- 201 Hasell Ct
- 416 Sanders Farm Ln