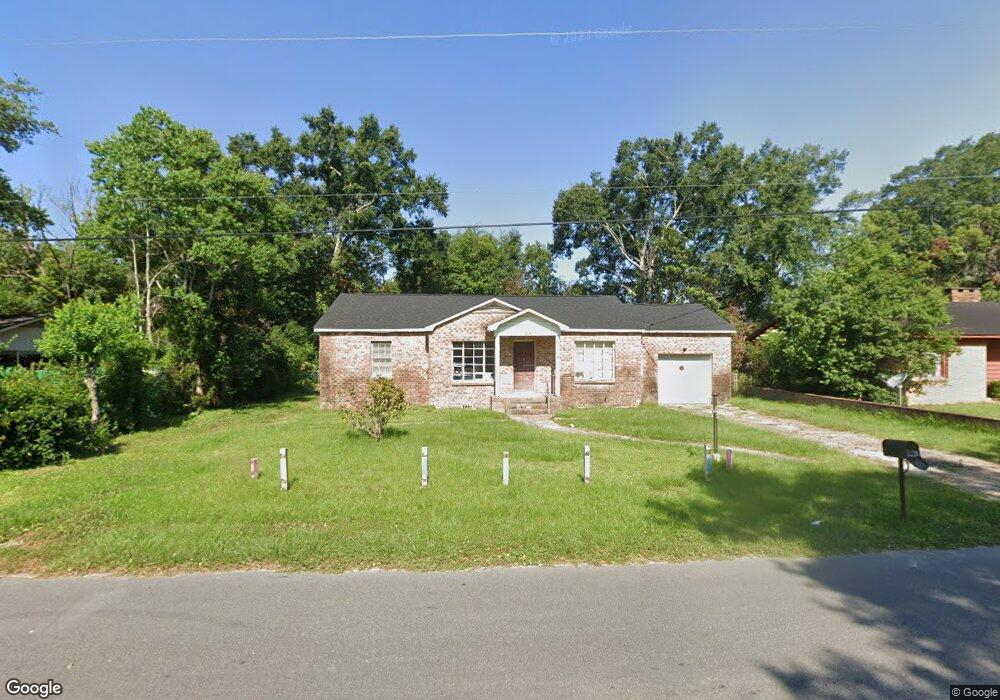
204 Johnston St Mobile, AL 36611
Estimated Value: $84,000 - $127,000
3
Beds
2
Baths
1,902
Sq Ft
$58/Sq Ft
Est. Value
About This Home
This home is located at 204 Johnston St, Mobile, AL 36611 and is currently estimated at $110,924, approximately $58 per square foot. 204 Johnston St is a home located in Mobile County with nearby schools including Chickasaw City Elementary School, Chickasaw City High School, and Prichard Preparatory School.
Ownership History
Date
Name
Owned For
Owner Type
Purchase Details
Closed on
Aug 3, 2022
Sold by
Dean Michael L and Dean Lela D
Bought by
Chase Manhattan Mortgage Corporation
Current Estimated Value
Purchase Details
Closed on
Sep 6, 2002
Sold by
Knight Wanda and Powell Miriam P
Bought by
Dean Michael L and Dean Lela D
Home Financials for this Owner
Home Financials are based on the most recent Mortgage that was taken out on this home.
Original Mortgage
$75,810
Interest Rate
6.4%
Mortgage Type
FHA
Create a Home Valuation Report for This Property
The Home Valuation Report is an in-depth analysis detailing your home's value as well as a comparison with similar homes in the area
Home Values in the Area
Average Home Value in this Area
Purchase History
| Date | Buyer | Sale Price | Title Company |
|---|---|---|---|
| Chase Manhattan Mortgage Corporation | $46,300 | Logs Legal Group Llp | |
| Dean Michael L | $77,000 | -- |
Source: Public Records
Mortgage History
| Date | Status | Borrower | Loan Amount |
|---|---|---|---|
| Previous Owner | Dean Michael L | $75,810 |
Source: Public Records
Tax History
| Year | Tax Paid | Tax Assessment Tax Assessment Total Assessment is a certain percentage of the fair market value that is determined by local assessors to be the total taxable value of land and additions on the property. | Land | Improvement |
|---|---|---|---|---|
| 2025 | $464 | $16,080 | $1,600 | $14,480 |
| 2024 | $464 | $15,100 | $1,600 | $13,500 |
| 2023 | $414 | $13,140 | $1,660 | $11,480 |
| 2022 | $285 | $6,550 | $830 | $5,720 |
| 2021 | $250 | $5,890 | $830 | $5,060 |
| 2020 | $252 | $5,930 | $830 | $5,100 |
| 2019 | $255 | $6,020 | $0 | $0 |
| 2018 | $255 | $6,020 | $0 | $0 |
| 2017 | $252 | $6,020 | $0 | $0 |
| 2016 | $273 | $6,420 | $0 | $0 |
| 2013 | $345 | $7,600 | $0 | $0 |
Source: Public Records
Map
Nearby Homes
Your Personal Tour Guide
Ask me questions while you tour the home.