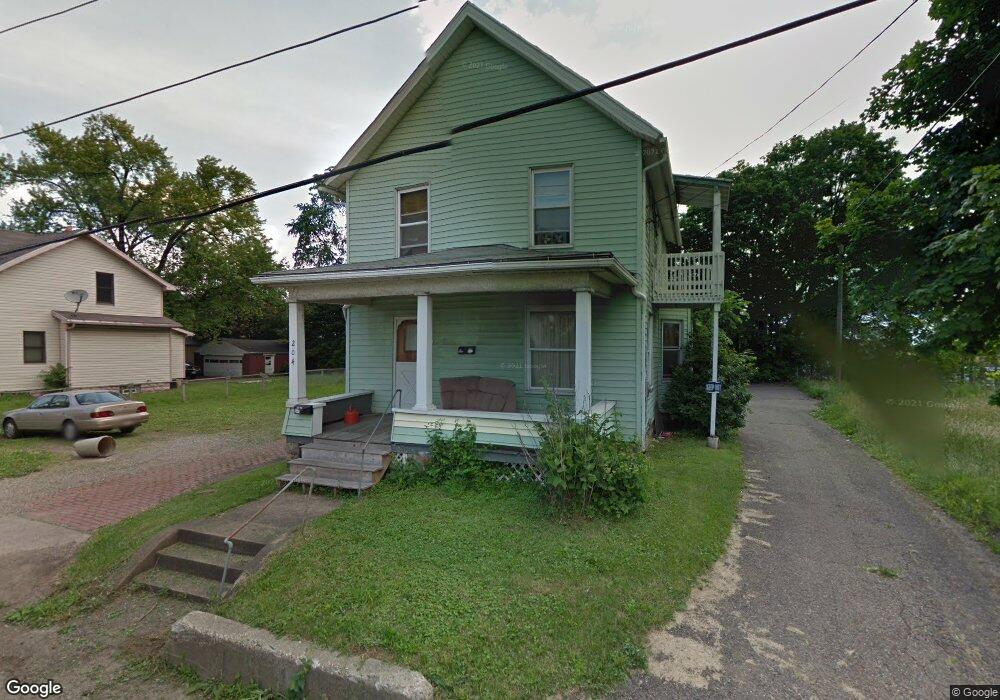
204 Lawn Ave NW Canton, OH 44708
Edmeyer Park NeighborhoodEstimated Value: $60,000 - $93,000
2
Beds
2
Baths
1,312
Sq Ft
$60/Sq Ft
Est. Value
About This Home
This home is located at 204 Lawn Ave NW, Canton, OH 44708 and is currently estimated at $78,481, approximately $59 per square foot. 204 Lawn Ave NW is a home located in Stark County with nearby schools including Harter Elementary School, Early Learning Center @ Schreiber, and Clarendon Intermediate School.
Ownership History
Date
Name
Owned For
Owner Type
Purchase Details
Closed on
Mar 15, 2018
Bought by
Bpf Investments Llc
Current Estimated Value
Purchase Details
Closed on
Mar 5, 2008
Sold by
Fannie Mae
Bought by
Frank Kevin A
Purchase Details
Closed on
Jul 10, 2007
Sold by
Hamdan Ahmad and Hamdan Fatin
Bought by
Farnol Michael R
Purchase Details
Closed on
May 7, 2007
Sold by
Farnol Michael R
Bought by
Hamdan Ahmad
Purchase Details
Closed on
Jan 18, 2007
Sold by
Farnol Michael R
Bought by
Fanniemae and Federal National Mortgage Association
Purchase Details
Closed on
Mar 1, 2002
Sold by
Mclaughlin Larry J and Mclaughlin Michele L
Bought by
Farnol Michael R
Purchase Details
Closed on
Sep 30, 1997
Sold by
Hoover Catherine I
Bought by
Mclaughlin Larry J
Home Financials for this Owner
Home Financials are based on the most recent Mortgage that was taken out on this home.
Original Mortgage
$37,800
Interest Rate
7.63%
Mortgage Type
New Conventional
Create a Home Valuation Report for This Property
The Home Valuation Report is an in-depth analysis detailing your home's value as well as a comparison with similar homes in the area
Home Values in the Area
Average Home Value in this Area
Purchase History
| Date | Buyer | Sale Price | Title Company |
|---|---|---|---|
| Bpf Investments Llc | -- | -- | |
| Frank Kevin A | $9,000 | Ohio Title Corporation | |
| Farnol Michael R | -- | Attorney | |
| Hamdan Ahmad | $48,300 | None Available | |
| Fanniemae | $28,000 | None Available | |
| Farnol Michael R | $35,000 | -- | |
| Mclaughlin Larry J | $72,000 | -- |
Source: Public Records
Mortgage History
| Date | Status | Borrower | Loan Amount |
|---|---|---|---|
| Previous Owner | Mclaughlin Larry J | $37,800 |
Source: Public Records
Tax History Compared to Growth
Tax History
| Year | Tax Paid | Tax Assessment Tax Assessment Total Assessment is a certain percentage of the fair market value that is determined by local assessors to be the total taxable value of land and additions on the property. | Land | Improvement |
|---|---|---|---|---|
| 2025 | $779 | $15,440 | $1,610 | $13,830 |
| 2024 | $244 | $15,440 | $1,610 | $13,830 |
| 2023 | $909 | $6,580 | $1,260 | $5,320 |
| 2022 | $395 | $6,580 | $1,260 | $5,320 |
| 2021 | $399 | $6,580 | $1,260 | $5,320 |
| 2020 | $406 | $5,990 | $1,090 | $4,900 |
| 2019 | $356 | $5,990 | $1,090 | $4,900 |
| 2018 | $358 | $5,990 | $1,090 | $4,900 |
| 2017 | $346 | $5,260 | $1,020 | $4,240 |
| 2016 | $244 | $3,680 | $1,020 | $2,660 |
| 2015 | $246 | $3,680 | $1,020 | $2,660 |
| 2014 | $266 | $3,750 | $1,050 | $2,700 |
| 2013 | $131 | $3,750 | $1,050 | $2,700 |
Source: Public Records
Map
Nearby Homes
- 202 Lincoln Ave NW
- 201 Park Ave NW
- 435 Hazlett Ave NW
- 633 Park Ave SW
- 631 Greenfield Ave SW
- 241 Raymont Ct SW
- 646 Dueber Ave SW
- 719 Prospect Ave SW
- 521 Columbus Ave NW
- 354 Clarendon Ave NW
- 2310 7th St SW
- 1409 8th St NW
- 1405 8th St NW
- 817 Prospect Ave SW
- 2425 7th St NW
- 807 Bedford Ave NW
- 813 Bedford Ave NW
- 1111 2nd St NW
- 2616 Crown Place NW
- 2411 Strasser Place SW
- 201 Lawn Ave NW
- 208 Lawn Ave NW
- 1911 Tuscarawas St W Unit 1
- 1911 Tuscarawas St W
- 205 Lawn Ave NW
- 210 Lawn Ave NW
- 207 Lawn Ave NW
- 200 Park Ave NW
- 203 Lincoln Ave NW
- 212 Lawn Ave NW
- 206 Park Ave NW
- 209 Lincoln Ave NW
- 208 Park Ave NW
- 214 Park Ave NW
- 216 Lawn Ave NW
- 211 Lincoln Ave NW
- 217 Lawn Ave NW
- 218 Lawn Ave NW
- 1821 Tuscarawas St W
- 220 Park Ave NW