Estimated Value: $267,086 - $358,000
3
Beds
1
Bath
1,249
Sq Ft
$259/Sq Ft
Est. Value
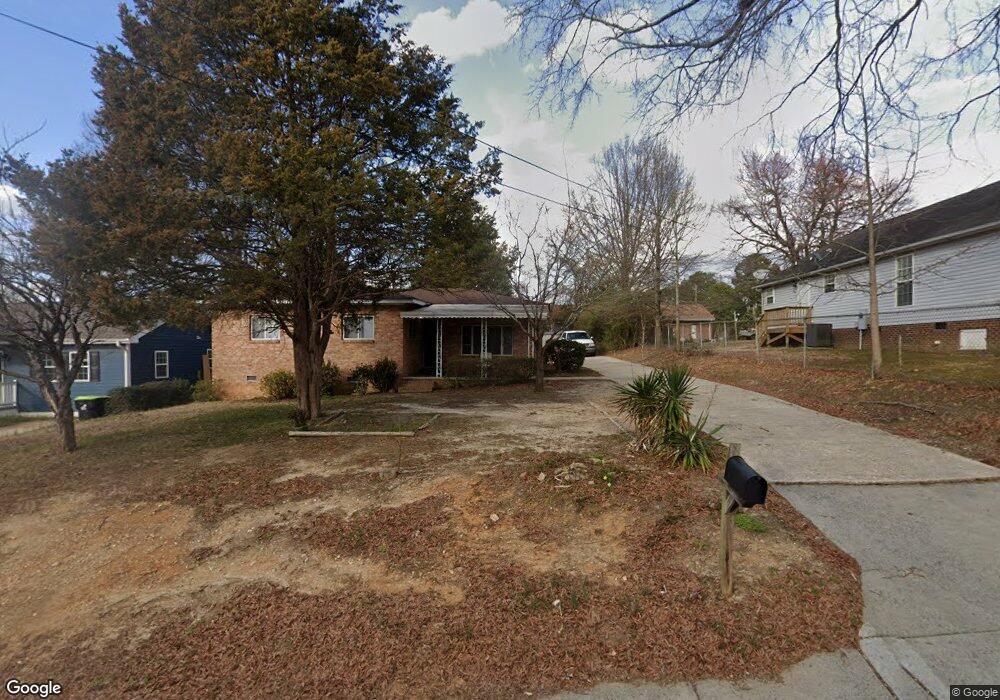
About This Home
This home is located at 204 Lynch St, Apex, NC 27502 and is currently estimated at $323,022, approximately $258 per square foot. 204 Lynch St is a home located in Wake County with nearby schools including Baucom Elementary School, Apex Middle, and Apex High School.
Ownership History
Date
Name
Owned For
Owner Type
Purchase Details
Closed on
Nov 16, 2020
Sold by
Orchid Homes Llc
Bought by
206 Lynch Street Trust
Current Estimated Value
Purchase Details
Closed on
Mar 5, 2008
Sold by
Nagdi Jujar A
Bought by
Orchid Homes Llc
Home Financials for this Owner
Home Financials are based on the most recent Mortgage that was taken out on this home.
Original Mortgage
$272,270
Interest Rate
5.46%
Mortgage Type
Purchase Money Mortgage
Purchase Details
Closed on
Sep 27, 2007
Sold by
Kelly Damian O and Simms Kelly Denisha D
Bought by
Simms Kelly Denisha D
Home Financials for this Owner
Home Financials are based on the most recent Mortgage that was taken out on this home.
Original Mortgage
$55,080
Interest Rate
6.41%
Mortgage Type
Purchase Money Mortgage
Purchase Details
Closed on
Sep 26, 2007
Sold by
Price Margaret J and Lane Anita
Bought by
Nagdi Jujar A
Home Financials for this Owner
Home Financials are based on the most recent Mortgage that was taken out on this home.
Original Mortgage
$55,080
Interest Rate
6.41%
Mortgage Type
Purchase Money Mortgage
Create a Home Valuation Report for This Property
The Home Valuation Report is an in-depth analysis detailing your home's value as well as a comparison with similar homes in the area
Purchase History
| Date | Buyer | Sale Price | Title Company |
|---|---|---|---|
| 206 Lynch Street Trust | -- | None Listed On Document | |
| Orchid Homes Llc | -- | None Available | |
| Simms Kelly Denisha D | -- | None Available | |
| Nagdi Jujar A | $133,000 | None Available |
Source: Public Records
Mortgage History
| Date | Status | Borrower | Loan Amount |
|---|---|---|---|
| Previous Owner | Orchid Homes Llc | $272,270 | |
| Previous Owner | Simms Kelly Denisha D | $55,080 | |
| Previous Owner | Nagdi Jujar A | $55,080 |
Source: Public Records
Tax History
| Year | Tax Paid | Tax Assessment Tax Assessment Total Assessment is a certain percentage of the fair market value that is determined by local assessors to be the total taxable value of land and additions on the property. | Land | Improvement |
|---|---|---|---|---|
| 2025 | $2,053 | $232,830 | $130,000 | $102,830 |
| 2024 | $2,007 | $232,830 | $130,000 | $102,830 |
Source: Public Records
Map
Nearby Homes
- 1434 Salem Creek Dr
- 203 Milky Way Dr
- 1614 Brussels Dr
- 111 Lemon Drop Cir
- 307 S Elm St
- 102 Licorice Dr
- 318 Glaston Ct
- 120 Licorice Dr
- 1750 Minley Way
- 101 Harbor Haven Dr
- 506 W Chatham St
- 1008 Daresbury Dr
- 901 Woodbriar St
- 0-2932 Tingen Rd
- 110 Anterbury Dr
- 105 Cunningham St
- 309 Culvert St
- 311 Culvert St
- 314 Wrenn St
- 300 Pate St
Your Personal Tour Guide
Ask me questions while you tour the home.