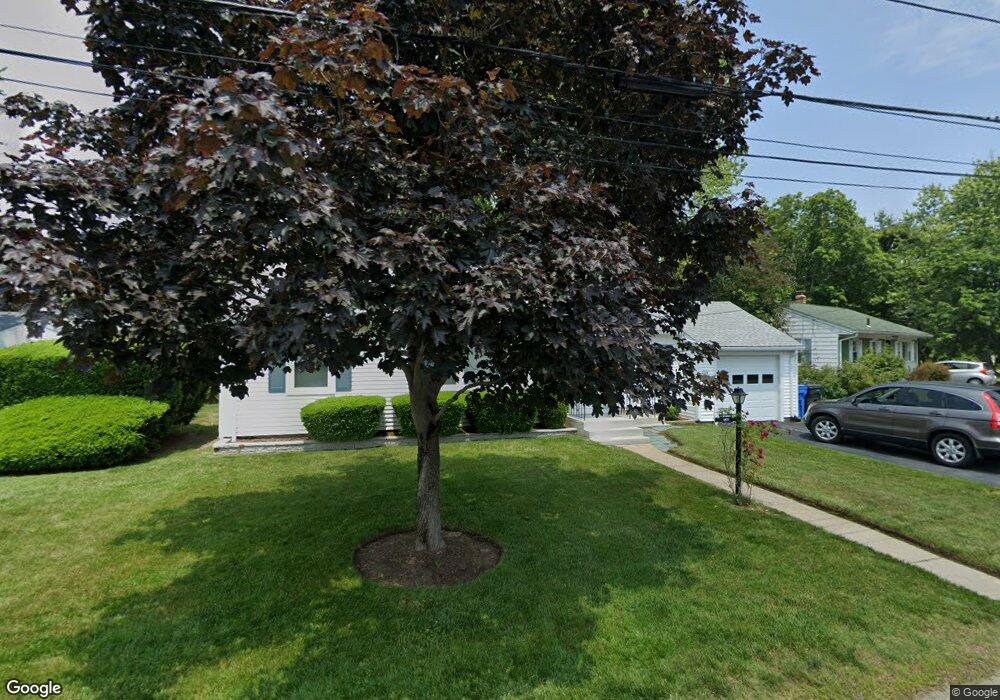
204 Mapleton St Cranston, RI 02910
Eden Park NeighborhoodEstimated Value: $330,000 - $396,000
2
Beds
1
Bath
1,070
Sq Ft
$339/Sq Ft
Est. Value
About This Home
This home is located at 204 Mapleton St, Cranston, RI 02910 and is currently estimated at $362,433, approximately $338 per square foot. 204 Mapleton St is a home located in Providence County with nearby schools including Park View Middle School, Cranston High School East, and Cadence Academy Preschool - Cranston.
Ownership History
Date
Name
Owned For
Owner Type
Purchase Details
Closed on
Dec 19, 1995
Sold by
Carr Mary I
Bought by
Smith Joyce B
Current Estimated Value
Home Financials for this Owner
Home Financials are based on the most recent Mortgage that was taken out on this home.
Original Mortgage
$65,000
Interest Rate
7.43%
Create a Home Valuation Report for This Property
The Home Valuation Report is an in-depth analysis detailing your home's value as well as a comparison with similar homes in the area
Home Values in the Area
Average Home Value in this Area
Purchase History
| Date | Buyer | Sale Price | Title Company |
|---|---|---|---|
| Smith Joyce B | $85,000 | -- |
Source: Public Records
Mortgage History
| Date | Status | Borrower | Loan Amount |
|---|---|---|---|
| Open | Smith Joyce B | $100,000 | |
| Closed | Smith Joyce B | $50,000 | |
| Closed | Smith Joyce B | $65,000 |
Source: Public Records
Tax History
| Year | Tax Paid | Tax Assessment Tax Assessment Total Assessment is a certain percentage of the fair market value that is determined by local assessors to be the total taxable value of land and additions on the property. | Land | Improvement |
|---|---|---|---|---|
| 2025 | $4,183 | $301,400 | $113,500 | $187,900 |
| 2024 | $4,102 | $301,400 | $113,500 | $187,900 |
| 2023 | $3,916 | $207,200 | $74,700 | $132,500 |
| 2022 | $3,835 | $207,200 | $74,700 | $132,500 |
| 2021 | $3,730 | $207,200 | $74,700 | $132,500 |
| 2020 | $3,687 | $177,500 | $71,200 | $106,300 |
| 2019 | $3,687 | $177,500 | $71,200 | $106,300 |
| 2018 | $3,601 | $177,500 | $71,200 | $106,300 |
| 2017 | $3,530 | $153,900 | $64,000 | $89,900 |
| 2016 | $3,455 | $153,900 | $64,000 | $89,900 |
| 2015 | $3,455 | $153,900 | $64,000 | $89,900 |
| 2014 | $3,403 | $149,000 | $64,000 | $85,000 |
Source: Public Records
Map
Nearby Homes
- 10 Dale Ave
- 10 Woburn St
- 103 Harper Ave
- 167 Forest Ave
- 33 Hemlock Ave
- 144 Laurens St
- 64 Holburn Ave
- 54 Holburn Ave
- 150 Riverside Ave
- 80 Colonial Ave
- 124 Clarence St
- 25 Sharon St Unit 2
- 181 Grace St
- 75 Sharon St
- 129 1st Ave
- 859 Pontiac Ave
- 152 Woodbine St
- 363 Pontiac Ave
- 90 Garden St
- 1302 Elmwood Ave
Your Personal Tour Guide
Ask me questions while you tour the home.