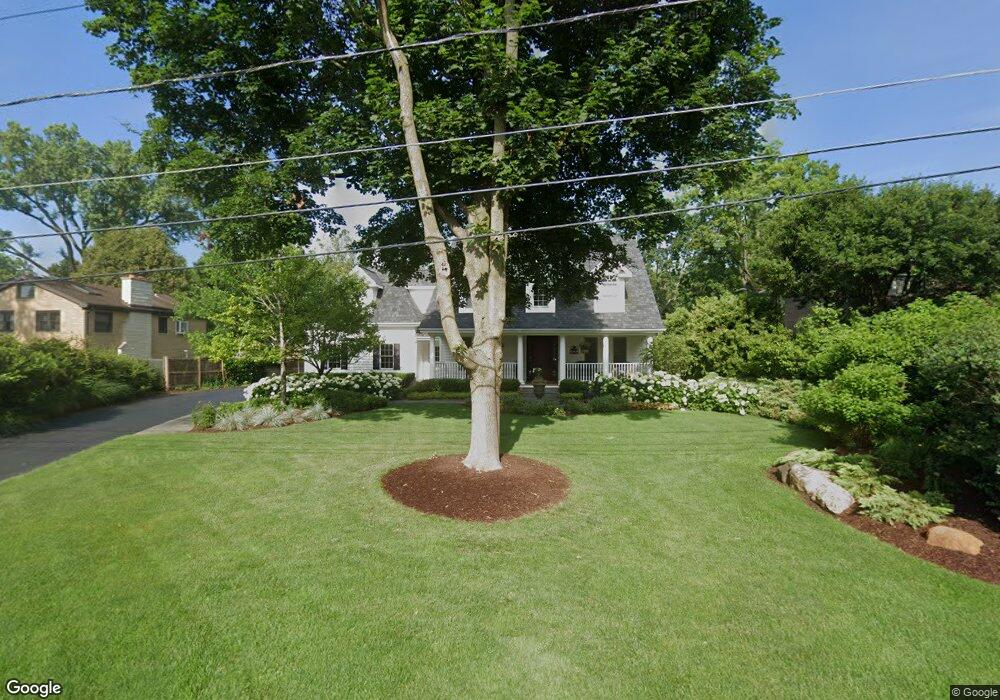
204 N Pine St Prospect Heights, IL 60070
Estimated Value: $826,000 - $974,000
4
Beds
4
Baths
3,578
Sq Ft
$249/Sq Ft
Est. Value
About This Home
This home is located at 204 N Pine St, Prospect Heights, IL 60070 and is currently estimated at $891,824, approximately $249 per square foot. 204 N Pine St is a home located in Cook County with nearby schools including Dwight D Eisenhower Elementary School, Anne Sullivan Elementary School, and Betsy Ross Elementary School.
Ownership History
Date
Name
Owned For
Owner Type
Purchase Details
Closed on
Apr 28, 1999
Sold by
Ogrady David P and Ogrady Kimberly
Bought by
Ogrady David P and Ogrady Kimberly L
Current Estimated Value
Home Financials for this Owner
Home Financials are based on the most recent Mortgage that was taken out on this home.
Original Mortgage
$250,000
Outstanding Balance
$63,954
Interest Rate
6.92%
Estimated Equity
$827,870
Purchase Details
Closed on
Apr 7, 1998
Sold by
Grabowski Shirley A
Bought by
Ogrady David and Ogrady Kimberly
Home Financials for this Owner
Home Financials are based on the most recent Mortgage that was taken out on this home.
Original Mortgage
$208,000
Interest Rate
7.27%
Purchase Details
Closed on
Jan 29, 1998
Sold by
Grabowski Lothar
Bought by
Grabowski Shirley A
Create a Home Valuation Report for This Property
The Home Valuation Report is an in-depth analysis detailing your home's value as well as a comparison with similar homes in the area
Home Values in the Area
Average Home Value in this Area
Purchase History
| Date | Buyer | Sale Price | Title Company |
|---|---|---|---|
| Ogrady David P | -- | -- | |
| Ogrady David | $208,000 | Lawyers Title Insurance Corp | |
| Grabowski Shirley A | -- | -- |
Source: Public Records
Mortgage History
| Date | Status | Borrower | Loan Amount |
|---|---|---|---|
| Open | Ogrady David P | $250,000 | |
| Closed | Ogrady David | $208,000 |
Source: Public Records
Tax History Compared to Growth
Tax History
| Year | Tax Paid | Tax Assessment Tax Assessment Total Assessment is a certain percentage of the fair market value that is determined by local assessors to be the total taxable value of land and additions on the property. | Land | Improvement |
|---|---|---|---|---|
| 2024 | $17,637 | $62,000 | $11,796 | $50,204 |
| 2023 | $16,507 | $62,000 | $11,796 | $50,204 |
| 2022 | $16,507 | $62,000 | $11,796 | $50,204 |
| 2021 | $15,865 | $51,714 | $10,321 | $41,393 |
| 2020 | $15,436 | $51,714 | $10,321 | $41,393 |
| 2019 | $15,424 | $57,846 | $10,321 | $47,525 |
| 2018 | $17,436 | $59,837 | $8,847 | $50,990 |
| 2017 | $17,258 | $59,837 | $8,847 | $50,990 |
| 2016 | $16,315 | $59,837 | $8,847 | $50,990 |
| 2015 | $15,405 | $51,654 | $7,372 | $44,282 |
| 2014 | $15,259 | $51,654 | $7,372 | $44,282 |
| 2013 | $14,866 | $51,654 | $7,372 | $44,282 |
Source: Public Records
Map
Nearby Homes
- 13 W Kenilworth Ave
- 107 W Brighton Place Unit T12
- 211 W Hanover Place Unit T85
- 505 N Maple St
- 412 W Olive Ave
- 1400 N Yarmouth Place Unit 113
- 1400 N Yarmouth Place Unit 315
- 300 E Marion Ave
- 1428 N Bridgeport Dr Unit T37
- 206 E Camp Mcdonald Rd
- 802 Butternut Ln Unit C
- 802 Butternut Ln Unit D
- 1400 N Elmhurst Rd Unit 302
- 1400 N Elmhurst Rd Unit 106
- 11 W Palatine Rd
- 910 Persimmon Ln Unit A
- 1401 Plum Ct Unit D
- 1311 Nutmeg Ct Unit A
- 2420 E Brandenberry Ct Unit 4C
- 2611 E Radford Ct