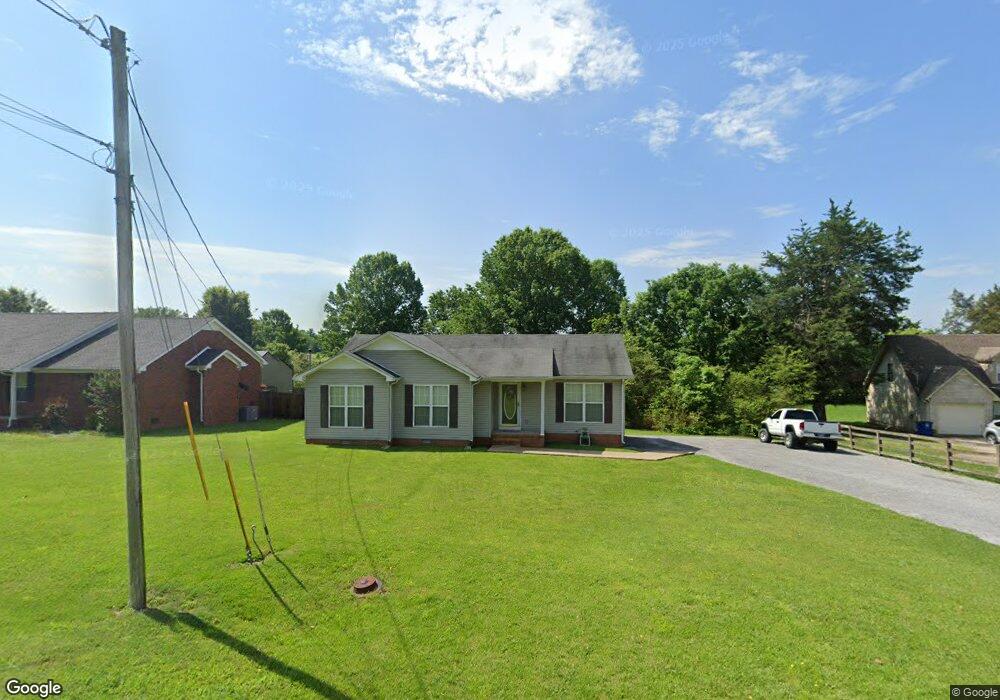
204 Narrows Rd Shelbyville, TN 37160
Estimated Value: $252,599 - $320,000
--
Bed
2
Baths
1,337
Sq Ft
$213/Sq Ft
Est. Value
About This Home
This home is located at 204 Narrows Rd, Shelbyville, TN 37160 and is currently estimated at $284,900, approximately $213 per square foot. 204 Narrows Rd is a home located in Bedford County with nearby schools including South Side Elementary School, Harris Middle School, and Christian Chapel Academy.
Ownership History
Date
Name
Owned For
Owner Type
Purchase Details
Closed on
Jun 8, 2021
Sold by
Pirtle Michael A
Bought by
Pirtle Michael A and Pirtle Teresa F
Current Estimated Value
Home Financials for this Owner
Home Financials are based on the most recent Mortgage that was taken out on this home.
Original Mortgage
$79,000
Outstanding Balance
$59,585
Interest Rate
2.9%
Mortgage Type
New Conventional
Estimated Equity
$225,315
Purchase Details
Closed on
Jun 3, 2000
Sold by
Walls William and Walls Sharon
Bought by
Pirtle Michael A
Purchase Details
Closed on
May 15, 2000
Sold by
Walls William and Walls Sharon
Bought by
Walls William and Walls Sharon
Purchase Details
Closed on
Jan 3, 2000
Bought by
Walls William Sharon
Purchase Details
Closed on
May 28, 1999
Bought by
Bill Daniel and Ragland William H
Purchase Details
Closed on
Dec 21, 1973
Bought by
Nance Edwin J and Nance James R
Create a Home Valuation Report for This Property
The Home Valuation Report is an in-depth analysis detailing your home's value as well as a comparison with similar homes in the area
Home Values in the Area
Average Home Value in this Area
Purchase History
| Date | Buyer | Sale Price | Title Company |
|---|---|---|---|
| Pirtle Michael A | -- | None Available | |
| Pirtle Michael A | $81,500 | -- | |
| Walls William | $12,500 | -- | |
| Walls William Sharon | $12,500 | -- | |
| Bill Daniel | $150,000 | -- | |
| Nance Edwin J | -- | -- |
Source: Public Records
Mortgage History
| Date | Status | Borrower | Loan Amount |
|---|---|---|---|
| Open | Pirtle Michael A | $79,000 |
Source: Public Records
Tax History Compared to Growth
Tax History
| Year | Tax Paid | Tax Assessment Tax Assessment Total Assessment is a certain percentage of the fair market value that is determined by local assessors to be the total taxable value of land and additions on the property. | Land | Improvement |
|---|---|---|---|---|
| 2025 | -- | $36,875 | $0 | $0 |
| 2024 | -- | $35,875 | $7,250 | $28,625 |
| 2023 | $1,365 | $35,875 | $7,250 | $28,625 |
| 2022 | $1,404 | $35,875 | $7,250 | $28,625 |
| 2021 | $1,275 | $35,875 | $7,250 | $28,625 |
| 2020 | $1,033 | $35,875 | $7,250 | $28,625 |
| 2019 | $1,033 | $23,325 | $4,500 | $18,825 |
| 2018 | $1,010 | $23,325 | $4,500 | $18,825 |
| 2017 | $1,010 | $23,325 | $4,500 | $18,825 |
| 2016 | $1,001 | $23,325 | $4,500 | $18,825 |
| 2015 | $1,001 | $23,325 | $4,500 | $18,825 |
| 2014 | $910 | $23,205 | $0 | $0 |
Source: Public Records
Map
Nearby Homes