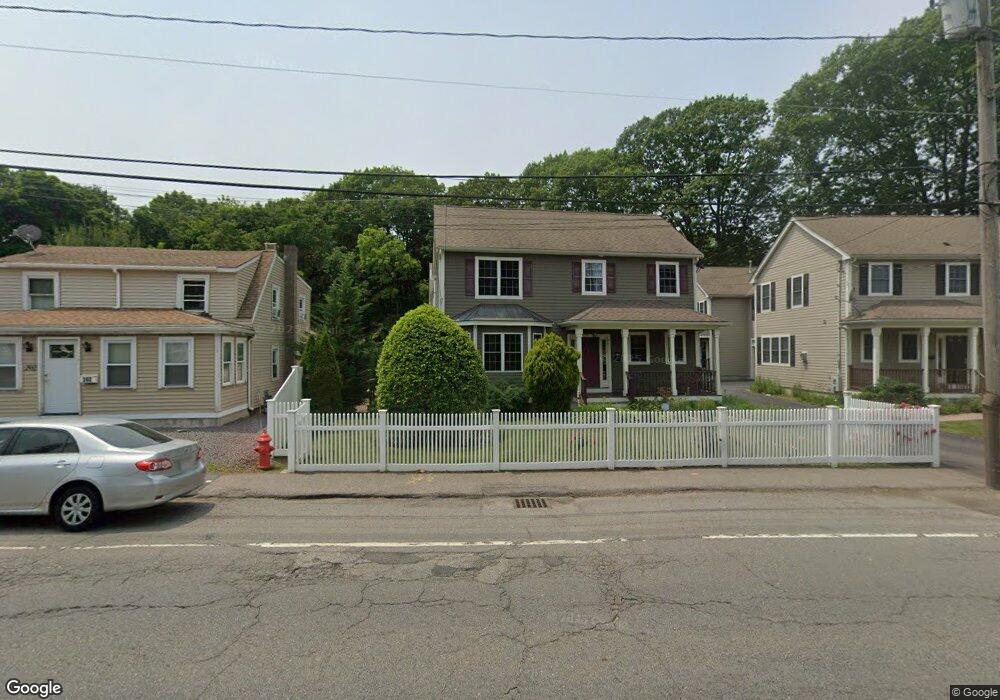
204 Neponset St Canton, MA 02021
Estimated Value: $689,000 - $720,788
3
Beds
3
Baths
1,800
Sq Ft
$391/Sq Ft
Est. Value
About This Home
This home is located at 204 Neponset St, Canton, MA 02021 and is currently estimated at $703,447, approximately $390 per square foot. 204 Neponset St is a home located in Norfolk County with nearby schools including Canton High School, St. John the Evangelist School, and Chabad Day School of School.
Ownership History
Date
Name
Owned For
Owner Type
Purchase Details
Closed on
Jul 14, 2015
Sold by
Pearlstein Jed and Pearlstein Ethan
Bought by
Bais Sampoorna U and Bais Umesh
Current Estimated Value
Home Financials for this Owner
Home Financials are based on the most recent Mortgage that was taken out on this home.
Original Mortgage
$326,000
Outstanding Balance
$126,253
Interest Rate
3.87%
Mortgage Type
New Conventional
Estimated Equity
$577,194
Purchase Details
Closed on
May 29, 2009
Sold by
Dmb Group Llc
Bought by
Pearlstein Jed and Pearlstein Zachary
Home Financials for this Owner
Home Financials are based on the most recent Mortgage that was taken out on this home.
Original Mortgage
$250,000
Interest Rate
4.87%
Mortgage Type
Purchase Money Mortgage
Purchase Details
Closed on
Jul 1, 2008
Sold by
G John Bertone Rt
Bought by
Dmb Group Llc
Home Financials for this Owner
Home Financials are based on the most recent Mortgage that was taken out on this home.
Original Mortgage
$572,000
Interest Rate
6.07%
Mortgage Type
Purchase Money Mortgage
Create a Home Valuation Report for This Property
The Home Valuation Report is an in-depth analysis detailing your home's value as well as a comparison with similar homes in the area
Home Values in the Area
Average Home Value in this Area
Purchase History
| Date | Buyer | Sale Price | Title Company |
|---|---|---|---|
| Bais Sampoorna U | $407,500 | -- | |
| Pearlstein Jed | $350,000 | -- | |
| Dmb Group Llc | $190,000 | -- |
Source: Public Records
Mortgage History
| Date | Status | Borrower | Loan Amount |
|---|---|---|---|
| Open | Bais Sampoorna U | $326,000 | |
| Previous Owner | Pearlstein Jed | $250,000 | |
| Previous Owner | Dmb Group Llc | $572,000 |
Source: Public Records
Tax History Compared to Growth
Tax History
| Year | Tax Paid | Tax Assessment Tax Assessment Total Assessment is a certain percentage of the fair market value that is determined by local assessors to be the total taxable value of land and additions on the property. | Land | Improvement |
|---|---|---|---|---|
| 2025 | $5,939 | $600,500 | $0 | $600,500 |
| 2024 | $5,759 | $577,600 | $0 | $577,600 |
| 2023 | $5,605 | $530,300 | $0 | $530,300 |
| 2022 | $5,635 | $496,500 | $0 | $496,500 |
| 2021 | $5,664 | $464,300 | $0 | $464,300 |
| 2020 | $5,463 | $446,700 | $0 | $446,700 |
| 2019 | $5,334 | $430,200 | $0 | $430,200 |
| 2018 | $4,952 | $398,700 | $0 | $398,700 |
| 2017 | $4,954 | $387,300 | $0 | $387,300 |
| 2016 | $5,658 | $442,400 | $0 | $442,400 |
| 2015 | $5,457 | $425,700 | $0 | $425,700 |
Source: Public Records
Map
Nearby Homes
- 25 Norfolk St
- 12 Concord Ave
- 251 Neponset St Unit 3
- 84 Walpole St Unit 1C
- 84 Walpole St Unit 6E
- 85 Neponset St Unit 85
- 83 Neponset St Unit 83
- 59 Walpole St Unit 115
- 200 Revere St Unit 305
- 17 Neponset St Unit A
- 354 Neponset St Unit M
- 21 Wall St Unit D
- 30 Coppersmith Way Unit 213
- 30 Coppersmith Way Unit 107
- 30 Coppersmith Way Unit 409
- 30 Coppersmith Way Unit 204
- 30 Coppersmith Way Unit 407
- 30 Coppersmith Way Unit 206
- 30 Coppersmith Way Unit 112
- 30 Coppersmith Way Unit 510
- 204 Neponset St Unit A
- 206 Neponset St
- 206 Neponset St Unit 206
- 204 Neponset St Unit 204
- 202 Neponset St
- 208 Neponset St
- 210 Neponset St
- 210 Neponset St Unit 210
- 196 Neponset St
- 194 Neponset St
- 220 Neponset St
- 220 Neponset St Unit 1
- 199 Neponset St
- 190 Neponset St
- 190 Neponset St Unit 2
- 190 Neponset St Unit 1
- 193 Neponset St
- 226 Neponset St
- 213 Neponset St Unit 213
- 217 Neponset St Unit 217