204 Rowell Rd Cordele, GA 31015
Estimated Value: $232,000 - $323,000
3
Beds
2
Baths
1,714
Sq Ft
$157/Sq Ft
Est. Value
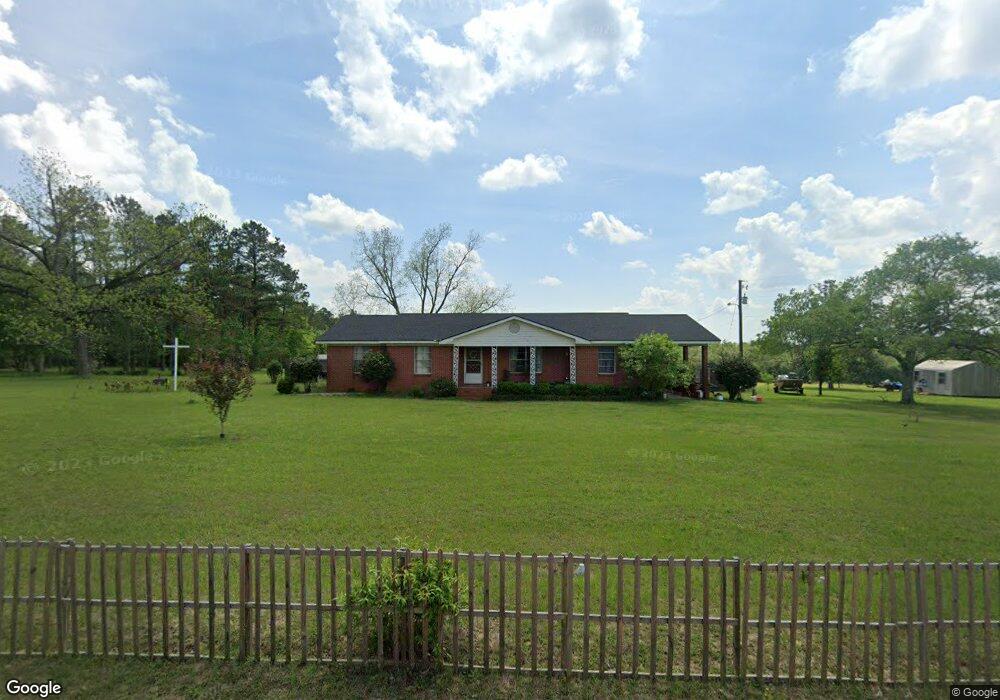
About This Home
This home is located at 204 Rowell Rd, Cordele, GA 31015 and is currently estimated at $269,513, approximately $157 per square foot. 204 Rowell Rd is a home located in Crisp County with nearby schools including Crisp County Primary School, Crisp County Elementary School, and Crisp County Middle School.
Ownership History
Date
Name
Owned For
Owner Type
Purchase Details
Closed on
Sep 20, 2012
Sold by
Rowell Ollie Frances
Bought by
Woods William M and Woods Wanda S
Current Estimated Value
Purchase Details
Closed on
Jan 1, 2011
Sold by
Rowell Ollie Frances
Bought by
Rowell Ollie Frances
Purchase Details
Closed on
Aug 9, 2010
Sold by
Rowell Russell Edward
Bought by
Rowell Ollie Frances
Purchase Details
Closed on
Dec 3, 1998
Sold by
Thomas D L Etal
Bought by
Rowell Russell Edwa
Purchase Details
Closed on
Aug 7, 1992
Sold by
Rowell F C Estate
Bought by
Rowell Pelam Etal
Purchase Details
Closed on
Sep 18, 1975
Bought by
Rowell F C Estate
Create a Home Valuation Report for This Property
The Home Valuation Report is an in-depth analysis detailing your home's value as well as a comparison with similar homes in the area
Home Values in the Area
Average Home Value in this Area
Purchase History
| Date | Buyer | Sale Price | Title Company |
|---|---|---|---|
| Woods William M | $120,000 | -- | |
| Rowell Ollie Frances | $159,000 | -- | |
| Rowell Ollie Frances | -- | -- | |
| Rowell Russell Edwa | -- | -- | |
| Rowell Pelam Etal | -- | -- | |
| Rowell F C Estate | -- | -- |
Source: Public Records
Tax History Compared to Growth
Tax History
| Year | Tax Paid | Tax Assessment Tax Assessment Total Assessment is a certain percentage of the fair market value that is determined by local assessors to be the total taxable value of land and additions on the property. | Land | Improvement |
|---|---|---|---|---|
| 2024 | $1,690 | $64,430 | $40,374 | $24,056 |
| 2023 | $2,189 | $79,941 | $57,313 | $22,628 |
| 2022 | $1,344 | $49,856 | $28,657 | $21,199 |
| 2021 | $1,436 | $48,427 | $28,657 | $19,770 |
| 2020 | $1,379 | $48,427 | $28,657 | $19,770 |
| 2019 | $1,370 | $48,427 | $28,657 | $19,770 |
| 2018 | $1,197 | $41,084 | $21,382 | $19,702 |
| 2017 | $1,263 | $41,084 | $21,382 | $19,702 |
| 2016 | $1,200 | $41,084 | $21,382 | $19,702 |
| 2015 | -- | $41,084 | $21,382 | $19,702 |
| 2014 | -- | $41,084 | $21,382 | $19,702 |
| 2013 | -- | $41,083 | $21,381 | $19,702 |
Source: Public Records
Map
Nearby Homes
- 846 Hawpond Rd
- 672 Brock Rd
- 2453 Georgia 90
- 0 Lost Rd
- 114 Brier Patch Rd
- 000 Brady Rd
- 3113 Old Hatley Rd
- 1806 Georgia 90
- 2905 Old Hatley Rd
- 2413 Old Hatley Rd
- 146 7th Ave W
- 0 Aberdeen Circle Lt# 28
- TBD Aberdeen Circle Lot#28
- 68 Aberdeen Cir
- 104 Aberdeen Cir
- 49 Aberdeen Cir
- Lot #13 Lakeview Dr
- 56 Aberdeen Cir
- 11 Lochridge Way
- 104 4th St