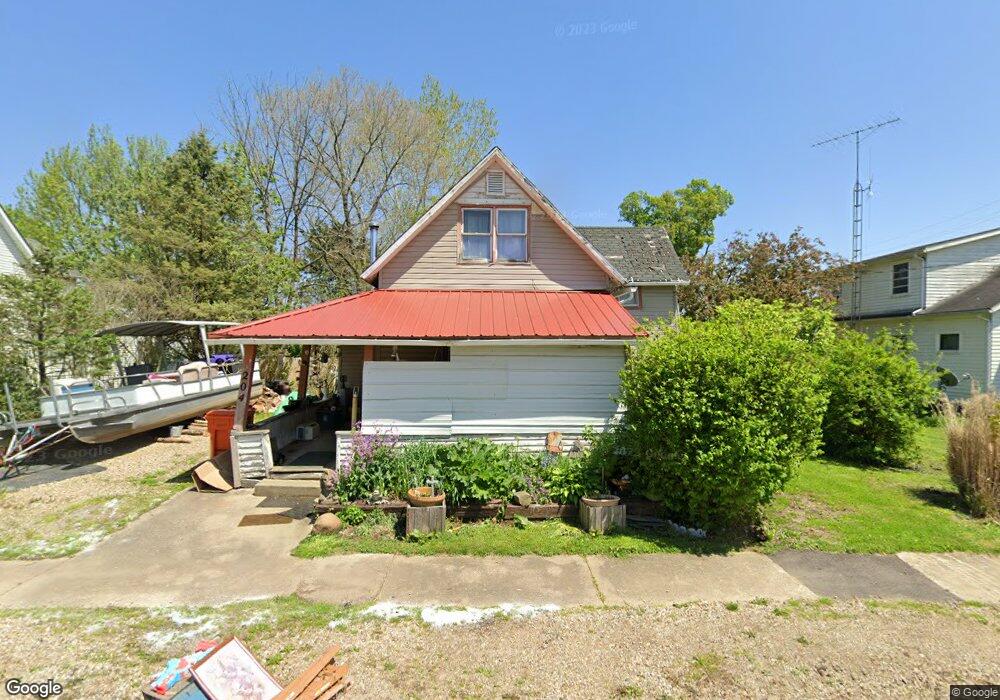
204 S Rogers St Mount Vernon, OH 43050
Estimated Value: $170,000 - $218,000
3
Beds
2
Baths
1,217
Sq Ft
$158/Sq Ft
Est. Value
About This Home
This home is located at 204 S Rogers St, Mount Vernon, OH 43050 and is currently estimated at $192,724, approximately $158 per square foot. 204 S Rogers St is a home located in Knox County with nearby schools including Mount Vernon High School, St. Vincent de Paul School, and Christian Star Academy.
Ownership History
Date
Name
Owned For
Owner Type
Purchase Details
Closed on
Oct 19, 2007
Sold by
Wood James E
Bought by
Wood James E and Wood Sarah J
Current Estimated Value
Home Financials for this Owner
Home Financials are based on the most recent Mortgage that was taken out on this home.
Original Mortgage
$53,250
Interest Rate
6.18%
Mortgage Type
New Conventional
Purchase Details
Closed on
Oct 26, 1998
Sold by
Small George A and Small Lynda
Bought by
Wood James E
Purchase Details
Closed on
Oct 29, 1997
Bought by
Small George A and Small Lynda
Purchase Details
Closed on
Apr 11, 1997
Sold by
Ostrander Marjorie A
Bought by
Ostrander Marjorie A Trus
Purchase Details
Closed on
Mar 6, 1997
Sold by
Ostrander Marjorie A and Ostrander Cu
Bought by
Ostrander Marjorie A
Purchase Details
Closed on
Dec 31, 1996
Sold by
Ostrander Jack I and Ostrander Marjor
Bought by
Ostrander Marjorie A and Ostrander Cu
Create a Home Valuation Report for This Property
The Home Valuation Report is an in-depth analysis detailing your home's value as well as a comparison with similar homes in the area
Home Values in the Area
Average Home Value in this Area
Purchase History
| Date | Buyer | Sale Price | Title Company |
|---|---|---|---|
| Wood James E | -- | None Available | |
| Wood James E | $52,000 | -- | |
| Small George A | $32,500 | -- | |
| Ostrander Marjorie A Trus | -- | -- | |
| Ostrander Marjorie A | -- | -- | |
| Ostrander Marjorie A | -- | -- |
Source: Public Records
Mortgage History
| Date | Status | Borrower | Loan Amount |
|---|---|---|---|
| Closed | Wood James E | $53,250 |
Source: Public Records
Tax History Compared to Growth
Tax History
| Year | Tax Paid | Tax Assessment Tax Assessment Total Assessment is a certain percentage of the fair market value that is determined by local assessors to be the total taxable value of land and additions on the property. | Land | Improvement |
|---|---|---|---|---|
| 2024 | $1,375 | $35,630 | $10,010 | $25,620 |
| 2023 | $1,377 | $35,630 | $10,010 | $25,620 |
| 2022 | $1,212 | $28,510 | $8,010 | $20,500 |
| 2021 | $1,212 | $28,510 | $8,010 | $20,500 |
| 2020 | $1,181 | $28,510 | $8,010 | $20,500 |
| 2019 | $1,101 | $24,770 | $10,820 | $13,950 |
| 2018 | $1,101 | $24,770 | $10,820 | $13,950 |
| 2017 | $1,081 | $24,770 | $10,820 | $13,950 |
| 2016 | $1,003 | $22,930 | $10,010 | $12,920 |
| 2015 | $1,007 | $22,930 | $10,010 | $12,920 |
| 2014 | $1,013 | $22,930 | $10,010 | $12,920 |
| 2013 | $1,054 | $22,670 | $10,410 | $12,260 |
Source: Public Records
Map
Nearby Homes