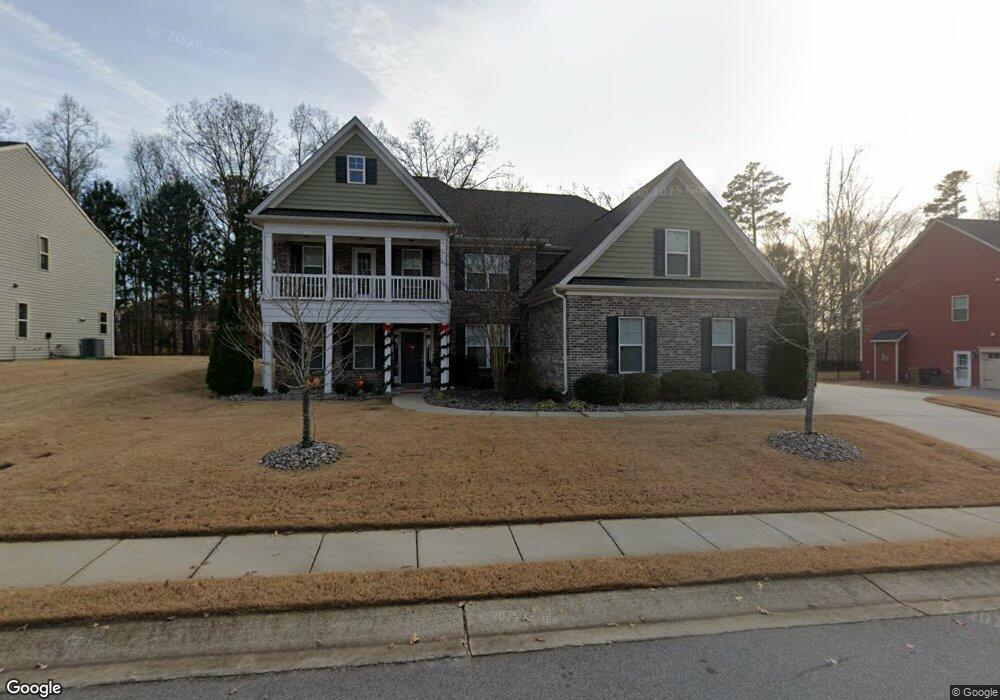
204 Siena Way Clayton, NC 27527
Estimated Value: $613,286 - $636,000
4
Beds
4
Baths
4,018
Sq Ft
$156/Sq Ft
Est. Value
About This Home
This home is located at 204 Siena Way, Clayton, NC 27527 and is currently estimated at $627,822, approximately $156 per square foot. 204 Siena Way is a home located in Johnston County with nearby schools including Riverwood Middle School, Clayton High, and Thales Academy at Flowers Plantation PreK-7.
Ownership History
Date
Name
Owned For
Owner Type
Purchase Details
Closed on
Apr 12, 2021
Sold by
Lowe Clyde L and Lowe Sara J
Bought by
Fogg Dana Deleon
Current Estimated Value
Home Financials for this Owner
Home Financials are based on the most recent Mortgage that was taken out on this home.
Original Mortgage
$436,000
Outstanding Balance
$393,020
Interest Rate
2.9%
Mortgage Type
VA
Estimated Equity
$234,802
Purchase Details
Closed on
Jul 23, 2018
Sold by
Halldorson Michael and Halldorson Antoinette
Bought by
Lowe Clyde L and Lowe Sara J
Home Financials for this Owner
Home Financials are based on the most recent Mortgage that was taken out on this home.
Original Mortgage
$296,000
Interest Rate
4.5%
Mortgage Type
New Conventional
Purchase Details
Closed on
Jul 24, 2016
Sold by
42 East Llc
Bought by
Halldorson Michael E and Halldorson Antoinete
Home Financials for this Owner
Home Financials are based on the most recent Mortgage that was taken out on this home.
Original Mortgage
$249,800
Interest Rate
3.54%
Mortgage Type
New Conventional
Create a Home Valuation Report for This Property
The Home Valuation Report is an in-depth analysis detailing your home's value as well as a comparison with similar homes in the area
Home Values in the Area
Average Home Value in this Area
Purchase History
| Date | Buyer | Sale Price | Title Company |
|---|---|---|---|
| Fogg Dana Deleon | $435,000 | None Available | |
| Lowe Clyde L | $370,000 | None Available | |
| Halldorson Michael E | $370,000 | None Available |
Source: Public Records
Mortgage History
| Date | Status | Borrower | Loan Amount |
|---|---|---|---|
| Open | Fogg Dana Deleon | $436,000 | |
| Previous Owner | Lowe Clyde L | $296,000 | |
| Previous Owner | Halldorson Michael E | $249,800 |
Source: Public Records
Tax History Compared to Growth
Tax History
| Year | Tax Paid | Tax Assessment Tax Assessment Total Assessment is a certain percentage of the fair market value that is determined by local assessors to be the total taxable value of land and additions on the property. | Land | Improvement |
|---|---|---|---|---|
| 2025 | $3,878 | $655,730 | $65,000 | $590,730 |
| 2024 | $3,050 | $376,500 | $50,000 | $326,500 |
| 2023 | $3,050 | $376,500 | $50,000 | $326,500 |
| 2022 | $3,087 | $376,500 | $50,000 | $326,500 |
| 2021 | $3,087 | $376,500 | $50,000 | $326,500 |
| 2020 | $3,200 | $376,500 | $50,000 | $326,500 |
| 2019 | $3,200 | $376,500 | $50,000 | $326,500 |
| 2018 | $3,143 | $361,280 | $34,000 | $327,280 |
| 2017 | $3,143 | $361,280 | $34,000 | $327,280 |
| 2016 | $557 | $64,000 | $34,000 | $30,000 |
| 2015 | $296 | $39,000 | $34,000 | $5,000 |
| 2014 | $296 | $34,000 | $34,000 | $0 |
Source: Public Records
Map
Nearby Homes
- 345 Siena Way
- 94-246 Silent Bend Dr
- 104-245 Silent Bend Dr
- 14 W Milan Ct
- 165 Naples Ln
- 13 E Milan Ct
- 112 Castello Way
- 90 Paraggi Ct
- 239 Tuscan Ridge Way
- 154 Sicily Dr
- 78 Florence Dr
- 57 Florence Dr
- 31 W Copenhaver Dr
- 49 W Copenhaver Dr
- 69 S Stonehaven Way
- 103 S Stonehaven Way
- 140 E Ravano Dr
- 90 Isabella Ct
- 195 Italia Ln
- 170 San Periro Dr
- 228 Siena Way Unit 26
- 182 Siena Way
- 252 Siena Way Unit 25
- 209 Siena Way Unit 9
- 209 Siena Way
- 160 Siena Way
- 189 Siena Way
- 233 Siena Way Unit 10
- 233 Siena Way
- 163 Siena Way Unit 7
- 163 Siena Way
- 109 Salerno Dr
- 125 Salerno Dr
- 270 Siena Way
- 270 Siena Way Unit 24
- 253 Siena Way Unit 11
- 157 Salerno Dr
- 140 Siena Way
- 97 Salerno Dr
- 167 Salerno Dr