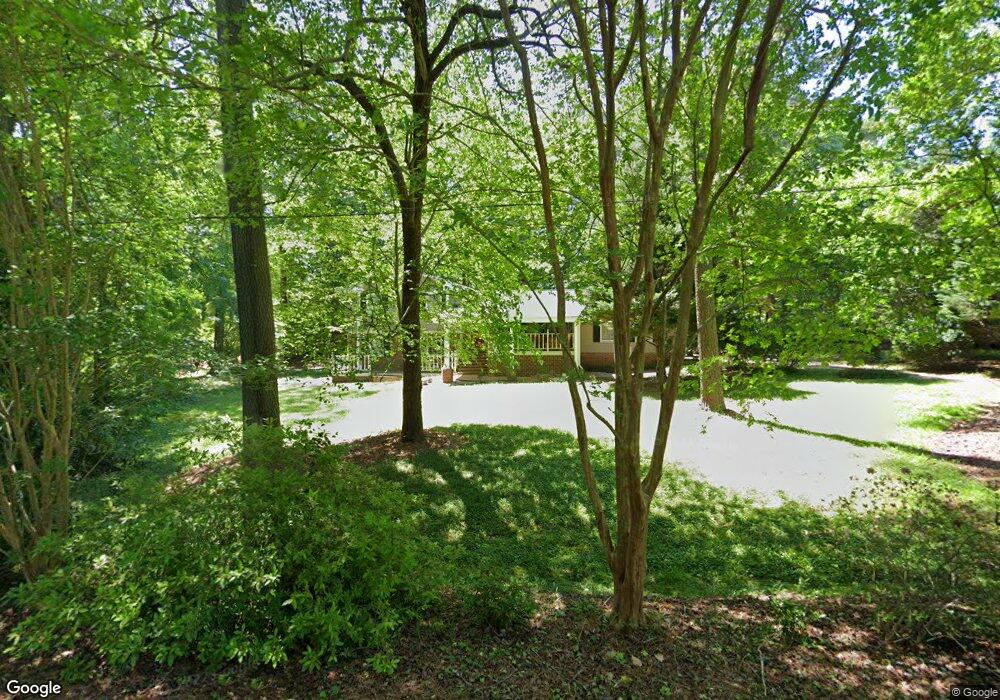
204 Singleton St Raleigh, NC 27606
West Raleigh NeighborhoodEstimated Value: $474,000 - $504,000
4
Beds
3
Baths
1,994
Sq Ft
$246/Sq Ft
Est. Value
About This Home
This home is located at 204 Singleton St, Raleigh, NC 27606 and is currently estimated at $489,818, approximately $245 per square foot. 204 Singleton St is a home located in Wake County with nearby schools including Reedy Creek Elementary School, Reedy Creek Magnet Middle School, and GRACE Christian School.
Ownership History
Date
Name
Owned For
Owner Type
Purchase Details
Closed on
Nov 19, 2003
Sold by
Deloach Gabriele and Deloach Billy Charles
Bought by
Elliason John and Elliason Michele L
Current Estimated Value
Home Financials for this Owner
Home Financials are based on the most recent Mortgage that was taken out on this home.
Original Mortgage
$168,600
Outstanding Balance
$77,783
Interest Rate
5.93%
Mortgage Type
Purchase Money Mortgage
Estimated Equity
$412,035
Purchase Details
Closed on
Apr 9, 2001
Sold by
Deloach Billy Charles and Deloach Gabriele
Bought by
Deloach Gabriele
Purchase Details
Closed on
Apr 28, 2000
Sold by
Austin Douglas J
Bought by
Deloach Billy Charles and Deloach Gabriele
Home Financials for this Owner
Home Financials are based on the most recent Mortgage that was taken out on this home.
Original Mortgage
$126,400
Interest Rate
10.49%
Create a Home Valuation Report for This Property
The Home Valuation Report is an in-depth analysis detailing your home's value as well as a comparison with similar homes in the area
Home Values in the Area
Average Home Value in this Area
Purchase History
| Date | Buyer | Sale Price | Title Company |
|---|---|---|---|
| Elliason John | $179,500 | -- | |
| Deloach Gabriele | -- | -- | |
| Deloach Billy Charles | $158,000 | -- |
Source: Public Records
Mortgage History
| Date | Status | Borrower | Loan Amount |
|---|---|---|---|
| Open | Elliason John | $168,600 | |
| Previous Owner | Deloach Billy Charles | $126,400 | |
| Closed | Deloach Billy Charles | $31,600 |
Source: Public Records
Tax History
| Year | Tax Paid | Tax Assessment Tax Assessment Total Assessment is a certain percentage of the fair market value that is determined by local assessors to be the total taxable value of land and additions on the property. | Land | Improvement |
|---|---|---|---|---|
| 2025 | $3,018 | $468,689 | $149,500 | $319,189 |
| 2024 | $2,931 | $468,689 | $149,500 | $319,189 |
Source: Public Records
Map
Nearby Homes
- 415 Bashford Rd
- 5608 Kimsey Ct
- 512 Bashford Rd
- 551 Oak Run Dr
- 2027 Oakdale Dr
- 6403 Myra Rd
- 6014 Farm Gate Rd
- 723 Orchard Vista Cir
- 721 Orchard Vista Cir
- 732 Orchard Vista Cir
- 730 Orchard Vista Cir
- 726 Orchard Vista Cir
- 724 Orchard Vista Cir
- 722 Orchard Vista Cir
- 720 Orchard Vista Cir
- 10 Red Ln
- 5920 Farm Gate Rd
- 712 Godwin Ct
- 701 Godwin Ct
- 113 Fieldspring Ln
- 200 Singleton St
- 212 Singleton St
- 124 Singleton St
- 216 Singleton St
- 321 Switch St
- 331 Switch St
- 335 Switch St
- 303 Switch St
- 305 Switch St
- 333 Switch St
- 311 Switch St
- 325 Switch St
- 309 Switch St
- 213 Singleton St
- 327 Switch St
- 120 Singleton St
- 307 Switch St
- 117 Singleton St
- 220 Singleton St
- 301 Switch St
Your Personal Tour Guide
Ask me questions while you tour the home.