Estimated Value: $170,000 - $235,000
3
Beds
1
Bath
1,248
Sq Ft
$159/Sq Ft
Est. Value
About This Home
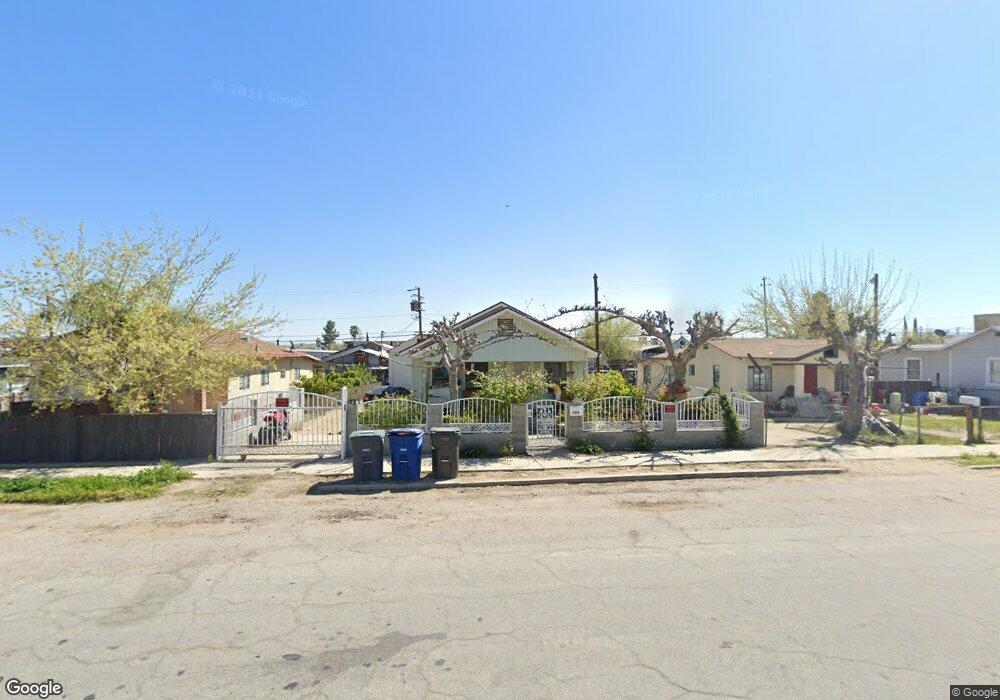
This home is located at 204 Tyler St, Taft, CA 93268 and is currently estimated at $198,400, approximately $158 per square foot. 204 Tyler St is a home located in Kern County with nearby schools including Jefferson Elementary School, Roosevelt Elementary School, and Lincoln Junior High School.
Ownership History
Date
Name
Owned For
Owner Type
Purchase Details
Closed on
Apr 22, 2011
Sold by
Federal National Mortgage Association
Bought by
Verduzco Efrain L
Current Estimated Value
Purchase Details
Closed on
Jan 11, 2011
Sold by
Lucatero Cesar H
Bought by
Federal National Mortgage Association
Purchase Details
Closed on
Apr 23, 2007
Sold by
Haase Janice Earlene and Estate Of Earl T Wildharber
Bought by
Lucatero Cesar H
Home Financials for this Owner
Home Financials are based on the most recent Mortgage that was taken out on this home.
Original Mortgage
$187,500
Interest Rate
6.21%
Mortgage Type
Purchase Money Mortgage
Create a Home Valuation Report for This Property
The Home Valuation Report is an in-depth analysis detailing your home's value as well as a comparison with similar homes in the area
Home Values in the Area
Average Home Value in this Area
Purchase History
| Date | Buyer | Sale Price | Title Company |
|---|---|---|---|
| Verduzco Efrain L | $60,000 | Lawyers Title Company | |
| Federal National Mortgage Association | $153,410 | None Available | |
| Lucatero Cesar H | $187,500 | Investors Title Company |
Source: Public Records
Mortgage History
| Date | Status | Borrower | Loan Amount |
|---|---|---|---|
| Previous Owner | Lucatero Cesar H | $187,500 |
Source: Public Records
Tax History Compared to Growth
Tax History
| Year | Tax Paid | Tax Assessment Tax Assessment Total Assessment is a certain percentage of the fair market value that is determined by local assessors to be the total taxable value of land and additions on the property. | Land | Improvement |
|---|---|---|---|---|
| 2025 | $3,296 | $78,138 | $25,617 | $52,521 |
| 2024 | $3,085 | $76,607 | $25,115 | $51,492 |
| 2023 | $3,085 | $75,106 | $24,623 | $50,483 |
| 2022 | $2,909 | $73,635 | $24,141 | $49,494 |
| 2021 | $2,817 | $72,192 | $23,668 | $48,524 |
| 2020 | $2,694 | $71,453 | $23,426 | $48,027 |
| 2019 | $2,661 | $71,453 | $23,426 | $48,027 |
| 2018 | $2,614 | $68,680 | $22,517 | $46,163 |
| 2017 | $2,582 | $67,334 | $22,076 | $45,258 |
| 2016 | $1,465 | $66,015 | $21,644 | $44,371 |
| 2015 | $1,360 | $65,024 | $21,319 | $43,705 |
| 2014 | $1,211 | $57,000 | $14,250 | $42,750 |
Source: Public Records
Map
Nearby Homes