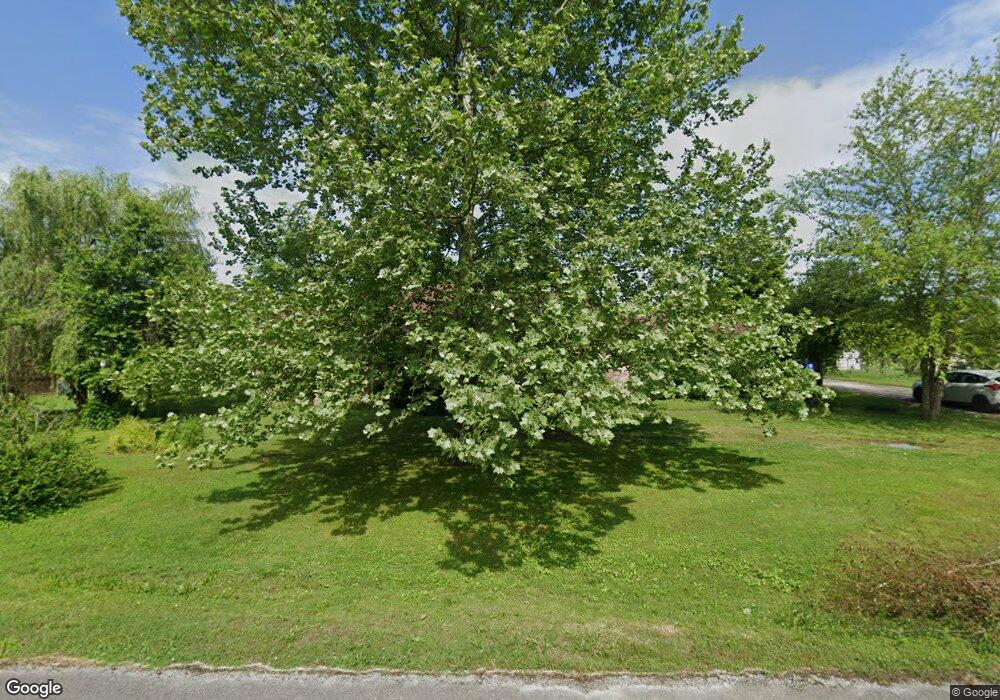
204 Tyne Rd Shelbyville, TN 37160
Estimated Value: $326,663 - $377,000
--
Bed
2
Baths
2,195
Sq Ft
$164/Sq Ft
Est. Value
About This Home
This home is located at 204 Tyne Rd, Shelbyville, TN 37160 and is currently estimated at $359,166, approximately $163 per square foot. 204 Tyne Rd is a home located in Bedford County with nearby schools including South Side Elementary School, Harris Middle School, and Christian Chapel Academy.
Ownership History
Date
Name
Owned For
Owner Type
Purchase Details
Closed on
Feb 23, 1998
Sold by
Cunningham Shirley
Bought by
Stolle Doanld and Stolle Lora
Current Estimated Value
Purchase Details
Closed on
Aug 31, 1993
Bought by
Cunningham Shirley
Purchase Details
Closed on
Aug 18, 1993
Bought by
Cunningham Shirley
Purchase Details
Closed on
May 1, 1991
Bought by
Daniels David H
Purchase Details
Closed on
Jul 13, 1990
Bought by
First American National Bk
Purchase Details
Closed on
Aug 11, 1988
Bought by
Peels John L and Annie Mai
Purchase Details
Closed on
Dec 9, 1986
Bought by
Peels John L and Annie Mai
Create a Home Valuation Report for This Property
The Home Valuation Report is an in-depth analysis detailing your home's value as well as a comparison with similar homes in the area
Home Values in the Area
Average Home Value in this Area
Purchase History
| Date | Buyer | Sale Price | Title Company |
|---|---|---|---|
| Stolle Doanld | $112,000 | -- | |
| Cunningham Shirley | $72,800 | -- | |
| Cunningham Shirley | -- | -- | |
| Daniels David H | $58,500 | -- | |
| First American National Bk | $58,000 | -- | |
| Peels John L | -- | -- | |
| Peels John L | -- | -- |
Source: Public Records
Tax History Compared to Growth
Tax History
| Year | Tax Paid | Tax Assessment Tax Assessment Total Assessment is a certain percentage of the fair market value that is determined by local assessors to be the total taxable value of land and additions on the property. | Land | Improvement |
|---|---|---|---|---|
| 2025 | -- | $61,375 | $0 | $0 |
| 2024 | -- | $61,375 | $12,500 | $48,875 |
| 2023 | $2,335 | $61,375 | $12,500 | $48,875 |
| 2022 | $2,403 | $61,375 | $12,500 | $48,875 |
| 2021 | $2,182 | $61,375 | $12,500 | $48,875 |
| 2020 | $1,650 | $61,375 | $12,500 | $48,875 |
| 2019 | $1,650 | $37,250 | $5,375 | $31,875 |
| 2018 | $1,613 | $37,250 | $5,375 | $31,875 |
| 2017 | $1,613 | $37,250 | $5,375 | $31,875 |
| 2016 | $1,598 | $37,250 | $5,375 | $31,875 |
| 2015 | $1,598 | $37,250 | $5,375 | $31,875 |
| 2014 | $1,330 | $33,938 | $0 | $0 |
Source: Public Records
Map
Nearby Homes