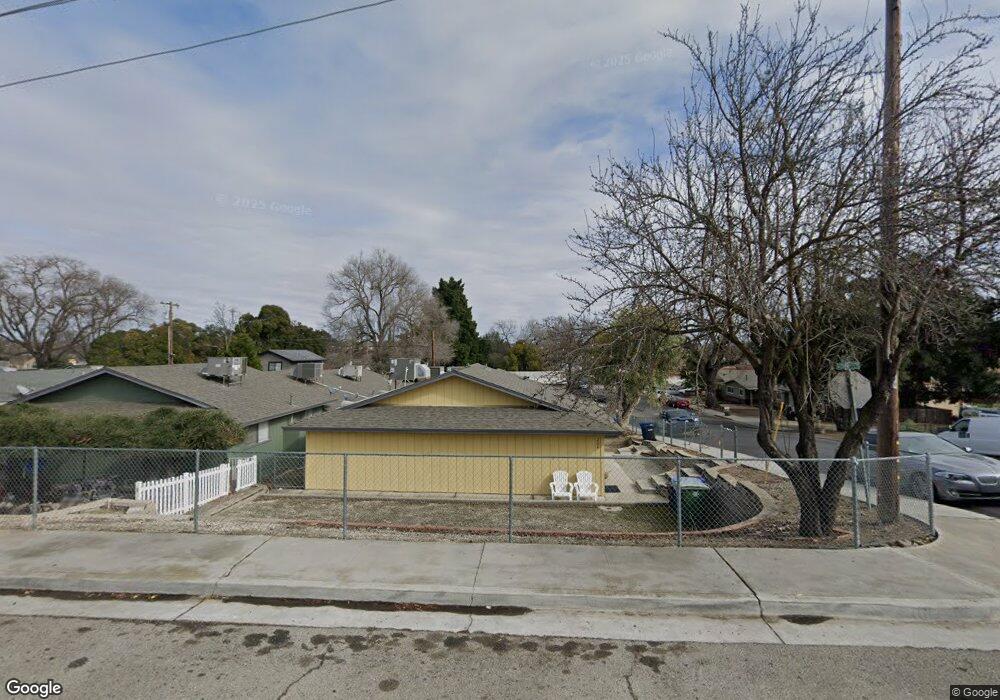
204 Vine St Paso Robles, CA 93446
Estimated Value: $605,000 - $1,417,000
6
Beds
3
Baths
2,940
Sq Ft
$315/Sq Ft
Est. Value
About This Home
This home is located at 204 Vine St, Paso Robles, CA 93446 and is currently estimated at $924,923, approximately $314 per square foot. 204 Vine St is a home located in San Luis Obispo County with nearby schools including Glen Speck Elementary School, George H. Flamson Middle School, and Paso Robles High School.
Ownership History
Date
Name
Owned For
Owner Type
Purchase Details
Closed on
Nov 13, 2013
Sold by
Dang Anthony Ba and Lam Nancy Ngo
Bought by
Dang Anthony B and Lam Nancy N
Current Estimated Value
Purchase Details
Closed on
Nov 16, 1998
Sold by
Devine Yuk Mei
Bought by
Dang Anthony Ba and Lam Nancy Nga
Home Financials for this Owner
Home Financials are based on the most recent Mortgage that was taken out on this home.
Original Mortgage
$121,600
Interest Rate
6.73%
Create a Home Valuation Report for This Property
The Home Valuation Report is an in-depth analysis detailing your home's value as well as a comparison with similar homes in the area
Purchase History
| Date | Buyer | Sale Price | Title Company |
|---|---|---|---|
| Dang Anthony B | -- | None Available | |
| Dang Anthony Ba | $152,000 | First American Title |
Source: Public Records
Mortgage History
| Date | Status | Borrower | Loan Amount |
|---|---|---|---|
| Previous Owner | Dang Anthony Ba | $121,600 |
Source: Public Records
Tax History
| Year | Tax Paid | Tax Assessment Tax Assessment Total Assessment is a certain percentage of the fair market value that is determined by local assessors to be the total taxable value of land and additions on the property. | Land | Improvement |
|---|---|---|---|---|
| 2025 | $2,597 | $238,267 | $70,537 | $167,730 |
| 2024 | $2,555 | $233,596 | $69,154 | $164,442 |
| 2023 | $2,555 | $229,017 | $67,799 | $161,218 |
| 2022 | $2,517 | $224,527 | $66,470 | $158,057 |
| 2021 | $2,474 | $220,125 | $65,167 | $154,958 |
| 2020 | $2,440 | $217,869 | $64,499 | $153,370 |
| 2019 | $2,405 | $213,598 | $63,235 | $150,363 |
| 2018 | $2,373 | $209,411 | $61,996 | $147,415 |
| 2017 | $2,231 | $205,306 | $60,781 | $144,525 |
| 2016 | $2,187 | $201,282 | $59,590 | $141,692 |
| 2015 | $2,179 | $198,259 | $58,695 | $139,564 |
| 2014 | $2,104 | $194,377 | $57,546 | $136,831 |
Source: Public Records
Map
Nearby Homes
- 143 Vine St
- 427 Olive St
- 170 Pacific Ave
- 153 Pacific Ave
- 649 Olive St
- 273 Pacific Ave
- 828 Spring St
- 806 Grove St
- 350 Robles Rd
- 490 Pacific Ave
- 215 Hilltop Dr
- 171 Bridgegate Ln
- 110 11th St
- 144 12th St
- 13625 California 46
- 1026 Merry Hill Rd
- 192 Sandbar Ct
- 1720 Willowbank Ln
- 1444 Oak St
- 66 Terrace Hill Dr
Your Personal Tour Guide
Ask me questions while you tour the home.