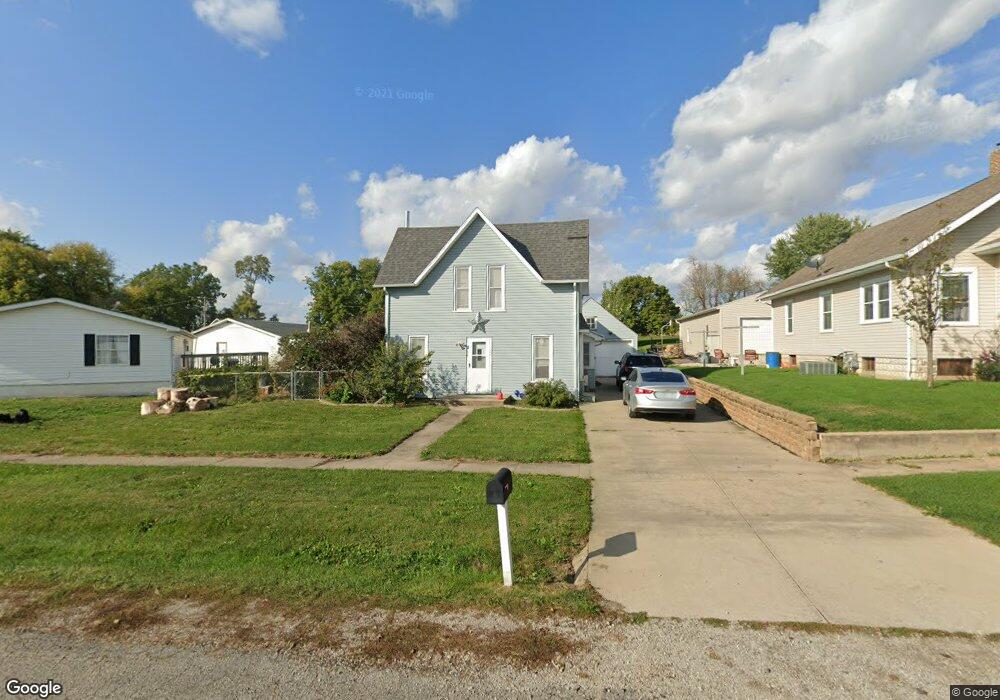
204 W Maple St Garrison, IA 52229
Estimated Value: $67,000 - $137,000
2
Beds
1
Bath
1,016
Sq Ft
$88/Sq Ft
Est. Value
About This Home
This home is located at 204 W Maple St, Garrison, IA 52229 and is currently estimated at $89,451, approximately $88 per square foot. 204 W Maple St is a home located in Benton County with nearby schools including Tilford Elementary School, Vinton-Shellsburg Middle School, and Vinton-Shellsburg High School.
Ownership History
Date
Name
Owned For
Owner Type
Purchase Details
Closed on
Mar 13, 2020
Sold by
Decker Nicholas
Bought by
Decker Kristin D and Kearns Kristin K
Current Estimated Value
Purchase Details
Closed on
Nov 1, 2011
Sold by
Vogeler Nathaniel T and Vogeler Lindsey R
Bought by
Decker Nicholas and Kearns Kristin K
Home Financials for this Owner
Home Financials are based on the most recent Mortgage that was taken out on this home.
Original Mortgage
$38,700
Interest Rate
4.5%
Mortgage Type
Adjustable Rate Mortgage/ARM
Create a Home Valuation Report for This Property
The Home Valuation Report is an in-depth analysis detailing your home's value as well as a comparison with similar homes in the area
Home Values in the Area
Average Home Value in this Area
Purchase History
| Date | Buyer | Sale Price | Title Company |
|---|---|---|---|
| Decker Kristin D | -- | None Available | |
| Decker Nicholas | $43,000 | None Available |
Source: Public Records
Mortgage History
| Date | Status | Borrower | Loan Amount |
|---|---|---|---|
| Previous Owner | Decker Nicholas | $38,700 |
Source: Public Records
Tax History Compared to Growth
Tax History
| Year | Tax Paid | Tax Assessment Tax Assessment Total Assessment is a certain percentage of the fair market value that is determined by local assessors to be the total taxable value of land and additions on the property. | Land | Improvement |
|---|---|---|---|---|
| 2025 | $1,260 | $74,100 | $5,600 | $68,500 |
| 2024 | $1,260 | $66,000 | $5,000 | $61,000 |
| 2023 | $1,040 | $66,000 | $5,000 | $61,000 |
| 2022 | $770 | $49,800 | $4,000 | $45,800 |
| 2021 | $770 | $49,800 | $4,000 | $45,800 |
| 2020 | $558 | $39,000 | $4,600 | $34,400 |
| 2019 | $464 | $39,000 | $4,600 | $34,400 |
| 2018 | $488 | $33,200 | $4,600 | $28,600 |
| 2017 | $488 | $33,200 | $4,600 | $28,600 |
| 2016 | $420 | $33,200 | $4,600 | $28,600 |
| 2015 | $420 | $33,200 | $4,600 | $28,600 |
| 2014 | $400 | $31,900 | $0 | $0 |
Source: Public Records
Map
Nearby Homes