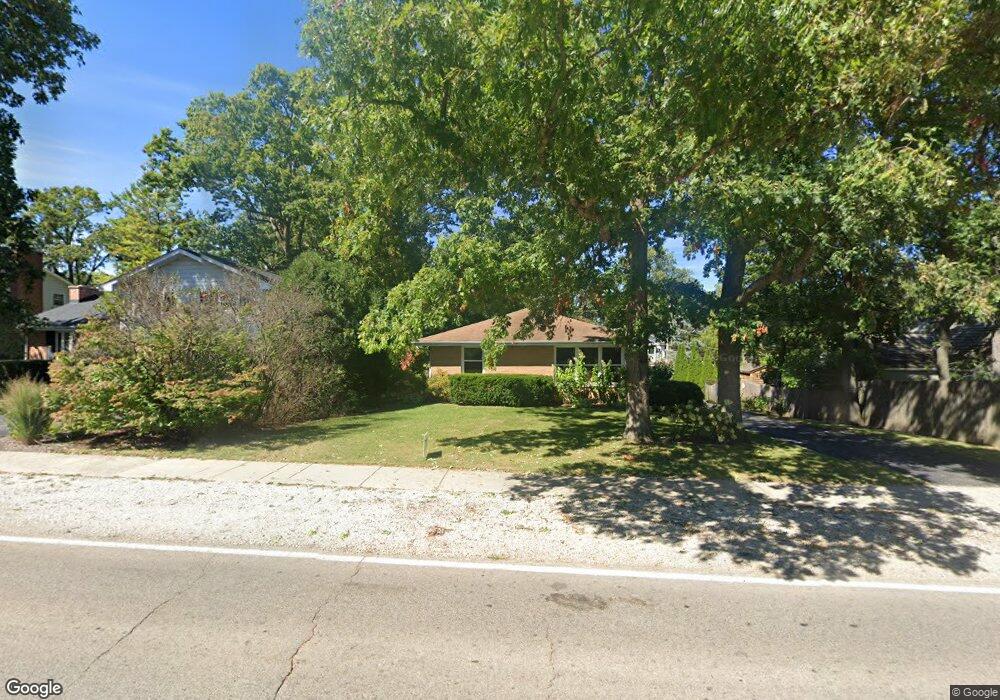
204 W Scranton Ave Lake Bluff, IL 60044
Estimated Value: $576,000 - $629,000
3
Beds
3
Baths
1,376
Sq Ft
$440/Sq Ft
Est. Value
About This Home
This home is located at 204 W Scranton Ave, Lake Bluff, IL 60044 and is currently estimated at $605,339, approximately $439 per square foot. 204 W Scranton Ave is a home located in Lake County with nearby schools including Lake Bluff Elementary School, Lake Bluff Middle School, and Lake Forest High School.
Ownership History
Date
Name
Owned For
Owner Type
Purchase Details
Closed on
Nov 21, 2024
Sold by
Arnold Sara E and Arnold James Robert
Bought by
Sara E Arnold Trust and Arnold
Current Estimated Value
Purchase Details
Closed on
May 22, 2012
Sold by
Behring Michael A and Behring Kathryn A
Bought by
Arnold Sara E
Home Financials for this Owner
Home Financials are based on the most recent Mortgage that was taken out on this home.
Original Mortgage
$150,000
Interest Rate
3.92%
Mortgage Type
New Conventional
Purchase Details
Closed on
Aug 12, 2003
Sold by
Neathery Van D
Bought by
Behring Michael A and Behring Kathryn A
Home Financials for this Owner
Home Financials are based on the most recent Mortgage that was taken out on this home.
Original Mortgage
$276,000
Interest Rate
6.43%
Mortgage Type
Purchase Money Mortgage
Create a Home Valuation Report for This Property
The Home Valuation Report is an in-depth analysis detailing your home's value as well as a comparison with similar homes in the area
Home Values in the Area
Average Home Value in this Area
Purchase History
| Date | Buyer | Sale Price | Title Company |
|---|---|---|---|
| Sara E Arnold Trust | -- | None Listed On Document | |
| Arnold Sara E | $285,000 | Fidelity Natl Title Ins Co | |
| Behring Michael A | $345,000 | -- |
Source: Public Records
Mortgage History
| Date | Status | Borrower | Loan Amount |
|---|---|---|---|
| Previous Owner | Arnold Sara E | $150,000 | |
| Previous Owner | Behring Michael A | $276,000 | |
| Closed | Behring Michael A | $51,750 |
Source: Public Records
Tax History Compared to Growth
Tax History
| Year | Tax Paid | Tax Assessment Tax Assessment Total Assessment is a certain percentage of the fair market value that is determined by local assessors to be the total taxable value of land and additions on the property. | Land | Improvement |
|---|---|---|---|---|
| 2024 | $8,229 | $145,465 | $86,888 | $58,577 |
| 2023 | $7,514 | $128,936 | $77,015 | $51,921 |
| 2022 | $7,514 | $117,212 | $70,012 | $47,200 |
| 2021 | $7,246 | $116,201 | $69,408 | $46,793 |
| 2020 | $7,265 | $124,988 | $69,792 | $55,196 |
| 2019 | $7,043 | $123,332 | $68,511 | $54,821 |
| 2018 | $7,014 | $127,610 | $67,010 | $60,600 |
| 2017 | $7,015 | $125,477 | $65,890 | $59,587 |
| 2016 | $7,440 | $119,434 | $62,717 | $56,717 |
| 2015 | $7,365 | $112,462 | $59,056 | $53,406 |
| 2014 | $5,874 | $90,764 | $53,020 | $37,744 |
| 2012 | $5,523 | $91,551 | $53,480 | $38,071 |
Source: Public Records
Map
Nearby Homes
- 208 Park Ln
- 120 E Scranton Ave Unit 202
- 120 E Scranton Ave Unit 203
- 120 E Scranton Ave Unit 201
- 120 E Scranton Ave Unit 102
- 120 E Scranton Ave Unit 103
- 117 E Washington Ave
- 1061 Green Bay Rd
- 55 Trowbridge Cir
- 8 Warrington Dr Unit 1
- 28 Warrington Dr
- 1010 Green Bay Rd
- 321 Newman Ct
- 39 Warrington Dr
- 308 Signe Ct
- 166 Park Ave
- 666 Maple Ave
- 188 Melvin Dr
- 246 Park Ave
- 1045 Green Bay Rd
- 212 W Scranton Ave
- 610 Lincoln Ave
- 209 Hancock Ave
- 216 W Scranton Ave
- 213 Hancock Ave
- 217 Hancock Ave
- 218 W Scranton Ave
- 605 Lincoln Ave
- 223 Hancock Ave
- 220 W Scranton Ave
- 613 Lincoln Ave
- 626 Lincoln Ave
- 617 Lincoln Ave
- 229 Hancock Ave
- 214 Hancock Ave
- 623 Lincoln Ave
- 204 W Center Ave
- 210 W Center Ave
- 216 W Center Ave
- 233 Hancock Ave