Estimated Value: $294,000 - $319,626
3
Beds
1
Bath
1,010
Sq Ft
$308/Sq Ft
Est. Value
About This Home
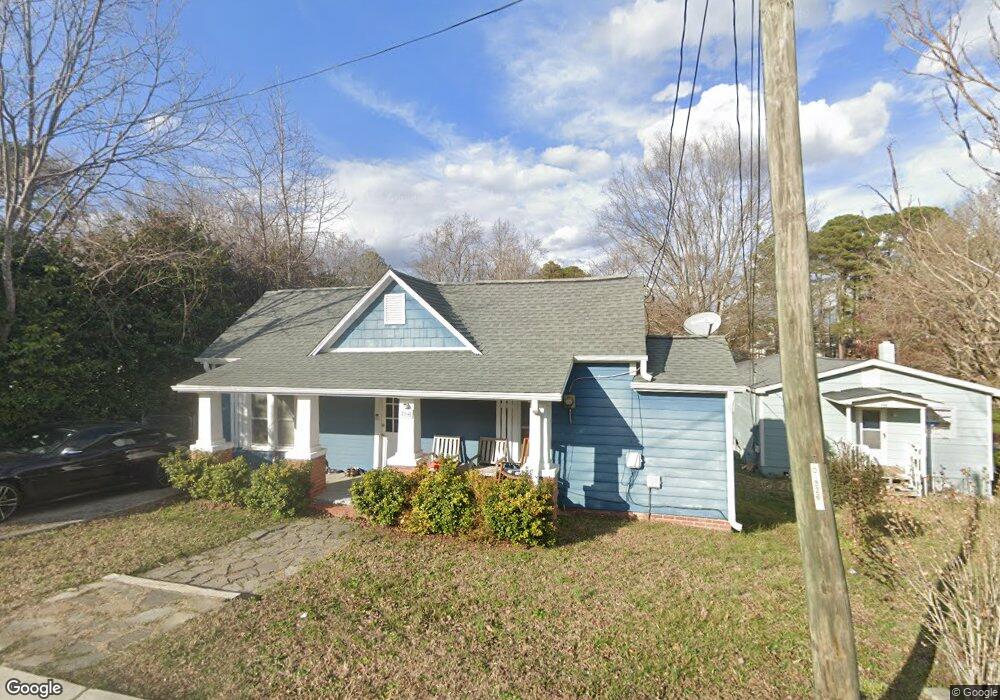
This home is located at 204 West St, Apex, NC 27502 and is currently estimated at $310,907, approximately $307 per square foot. 204 West St is a home located in Wake County with nearby schools including Baucom Elementary School, Apex Middle, and Apex High School.
Ownership History
Date
Name
Owned For
Owner Type
Purchase Details
Closed on
Feb 25, 2022
Sold by
Cope Alexander G and Cope Paige
Bought by
Jantz Kevin
Current Estimated Value
Home Financials for this Owner
Home Financials are based on the most recent Mortgage that was taken out on this home.
Original Mortgage
$275,500
Outstanding Balance
$256,309
Interest Rate
3.55%
Mortgage Type
New Conventional
Estimated Equity
$54,598
Purchase Details
Closed on
Jun 5, 2018
Sold by
Bilyard Amy
Bought by
Cope Alexander G and Cope Paige
Home Financials for this Owner
Home Financials are based on the most recent Mortgage that was taken out on this home.
Original Mortgage
$137,750
Interest Rate
4.5%
Mortgage Type
New Conventional
Purchase Details
Closed on
May 12, 2016
Sold by
Ray Laurita J
Bought by
Bilyard Amy
Purchase Details
Closed on
Nov 13, 2009
Sold by
Ray Laurita J
Bought by
Ray Laurita J
Create a Home Valuation Report for This Property
The Home Valuation Report is an in-depth analysis detailing your home's value as well as a comparison with similar homes in the area
Home Values in the Area
Average Home Value in this Area
Purchase History
| Date | Buyer | Sale Price | Title Company |
|---|---|---|---|
| Jantz Kevin | $290,000 | City Of Oaks Law | |
| Cope Alexander G | $145,000 | None Available | |
| Bilyard Amy | $67,000 | None Available | |
| Ray Laurita J | -- | None Available |
Source: Public Records
Mortgage History
| Date | Status | Borrower | Loan Amount |
|---|---|---|---|
| Open | Jantz Kevin | $275,500 | |
| Previous Owner | Cope Alexander G | $137,750 |
Source: Public Records
Tax History Compared to Growth
Tax History
| Year | Tax Paid | Tax Assessment Tax Assessment Total Assessment is a certain percentage of the fair market value that is determined by local assessors to be the total taxable value of land and additions on the property. | Land | Improvement |
|---|---|---|---|---|
| 2025 | $2,384 | $270,768 | $130,000 | $140,768 |
| 2024 | $2,331 | $270,768 | $130,000 | $140,768 |
| 2023 | $1,691 | $152,336 | $45,000 | $107,336 |
| 2022 | $1,588 | $152,336 | $45,000 | $107,336 |
| 2021 | $1,528 | $152,336 | $45,000 | $107,336 |
| 2020 | $1,513 | $152,336 | $45,000 | $107,336 |
| 2019 | $1,050 | $90,731 | $27,000 | $63,731 |
| 2018 | $554 | $49,915 | $27,000 | $22,915 |
| 2017 | $517 | $49,915 | $27,000 | $22,915 |
| 2016 | $509 | $49,915 | $27,000 | $22,915 |
| 2015 | $385 | $36,295 | $14,000 | $22,295 |
| 2014 | $371 | $36,295 | $14,000 | $22,295 |
Source: Public Records
Map
Nearby Homes
- 410 2nd St
- 406 S Salem St
- 1434 Salem Creek Dr
- 307 S Elm St
- 1614 Brussels Dr
- 318 Glaston Ct
- 202 W Chatham St
- 506 W Chatham St
- 1713 Yateley Ln
- 1004 Marston Ct
- 309 Culvert St
- 311 Culvert St
- 105 Cunningham St
- 1104 Barrow Nook Ct
- 314 Wrenn St
- 1464 Padstone Dr
- 0-2932 Tingen Rd
- 0 Jb Morgan Rd Unit 10051948
- 1039 Dual Parks Rd
- 209 Homegate Cir
- 200 West St
- - 1st St
- 0 1st St Unit 929633
- 0 1st St Unit 988766
- 0 1st St
- 206 West St
- 208 West St
- 201 West St
- 202 Baucom St
- 200 Baucom St
- 0 First St Unit 2313626
- 0 First St Unit TR988766
- 0 First St Unit RMRKS TR1755721
- 0 First St
- 502 1st St
- 206 Baucom St
- 207 West St
- 210 West St
- 113 West St
- 209 West St