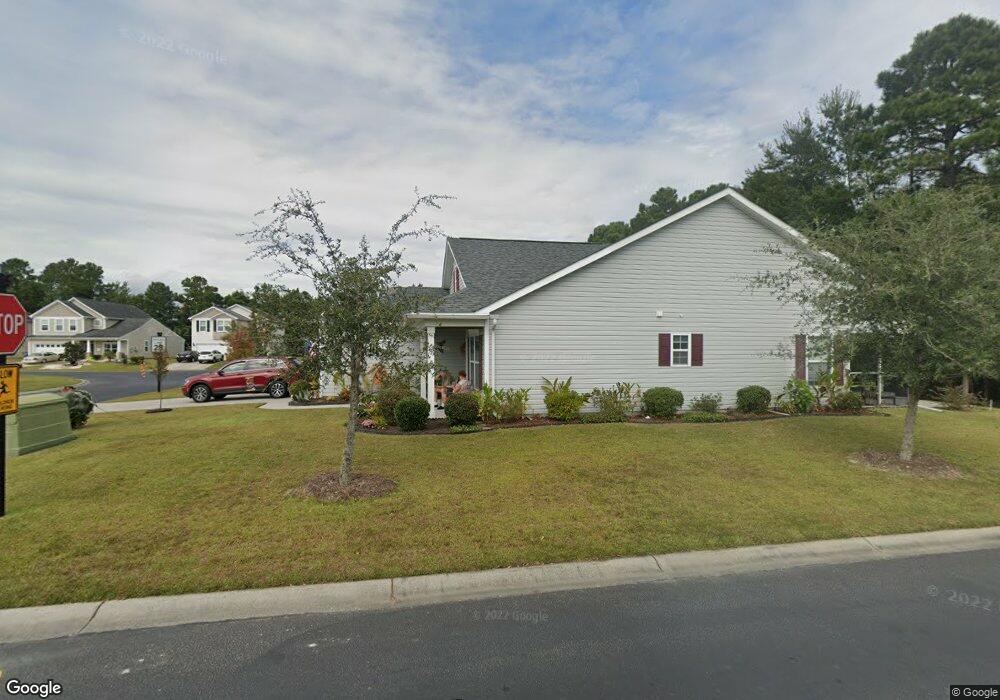
204 Whipple Run Loop Unit lot 52 Myrtle Beach, SC 29588
Burgess NeighborhoodEstimated Value: $365,000 - $417,000
3
Beds
2
Baths
2,240
Sq Ft
$171/Sq Ft
Est. Value
About This Home
This home is located at 204 Whipple Run Loop Unit lot 52, Myrtle Beach, SC 29588 and is currently estimated at $384,042, approximately $171 per square foot. 204 Whipple Run Loop Unit lot 52 is a home located in Horry County with nearby schools including St. James Elementary School, St. James Middle School, and St. James Intermediate.
Create a Home Valuation Report for This Property
The Home Valuation Report is an in-depth analysis detailing your home's value as well as a comparison with similar homes in the area
Home Values in the Area
Average Home Value in this Area
Tax History Compared to Growth
Tax History
| Year | Tax Paid | Tax Assessment Tax Assessment Total Assessment is a certain percentage of the fair market value that is determined by local assessors to be the total taxable value of land and additions on the property. | Land | Improvement |
|---|---|---|---|---|
| 2024 | $1,070 | $13,539 | $3,432 | $10,107 |
| 2023 | $1,070 | $9,279 | $1,709 | $7,570 |
| 2021 | $967 | $10,688 | $1,808 | $8,880 |
| 2020 | $852 | $10,688 | $1,808 | $8,880 |
| 2019 | $852 | $10,688 | $1,808 | $8,880 |
| 2018 | $767 | $8,069 | $1,485 | $6,584 |
| 2017 | $752 | $8,069 | $1,485 | $6,584 |
| 2016 | -- | $8,069 | $1,485 | $6,584 |
| 2015 | $767 | $8,069 | $1,485 | $6,584 |
| 2014 | $709 | $8,069 | $1,485 | $6,584 |
Source: Public Records
Map
Nearby Homes
- 357 Winslow Ave
- 1392 Brighton Ave
- TBD W Highway 707 Unit Lot D
- 337 Skyland Pines Dr
- 9514 Leeds Cir Unit MB
- 4842 Timberlake Dr
- 6374 David Ln
- 6362 David Ln
- 312 Cattle Drive Cir
- TBD Honeydew Rd Unit 2C-7
- 150 Honeydew Rd
- 1530 Palmina Loop Unit D
- 1011 Weslin Creek Dr
- 114 Turnberry Ct
- 100 Inverness Ct
- - S Carolina 707
- 7770 S Carolina 707
- 6477 Royal Pine Dr
- 6469 Royal Pine Dr
- 502 Gleneagles Dr
- 204 Whipple Run Loop
- 200 Whipple Run Loop
- 200 Whipple Run Loop Unit Lot 53 "Ashley"
- 208 Whipple Run Loop
- 208 Whipple Run Loop Unit Lot 51
- 450 Whipple Run Loop Unit "Concord" Lot 54
- 450 Whipple Run Loop Unit "Santee" Lot 54
- 450 Whipple Run Loop Unit "Sumter" Lot 54
- 450 Whipple Run Loop Unit "Okatie" Lot 54
- 450 Whipple Run Loop Unit "Camden" Lot 54
- 450 Whipple Run Loop Unit "Ashley" Lot 54
- 450 Whipple Run Loop Unit "Blacksburg" Lot 54
- 212 Whipple Run Loop
- 460 Whipple Run Loop
- 216 Whipple Run Loop
- 216 Whipple Run Loop Unit Lot 49
- 220 Whipple Run Loop
- Parcel D Winningham Ln
- 456 Whipple Run Loop Unit "Ashley" Lot 55 Mode
- 224 Whipple Run Loop