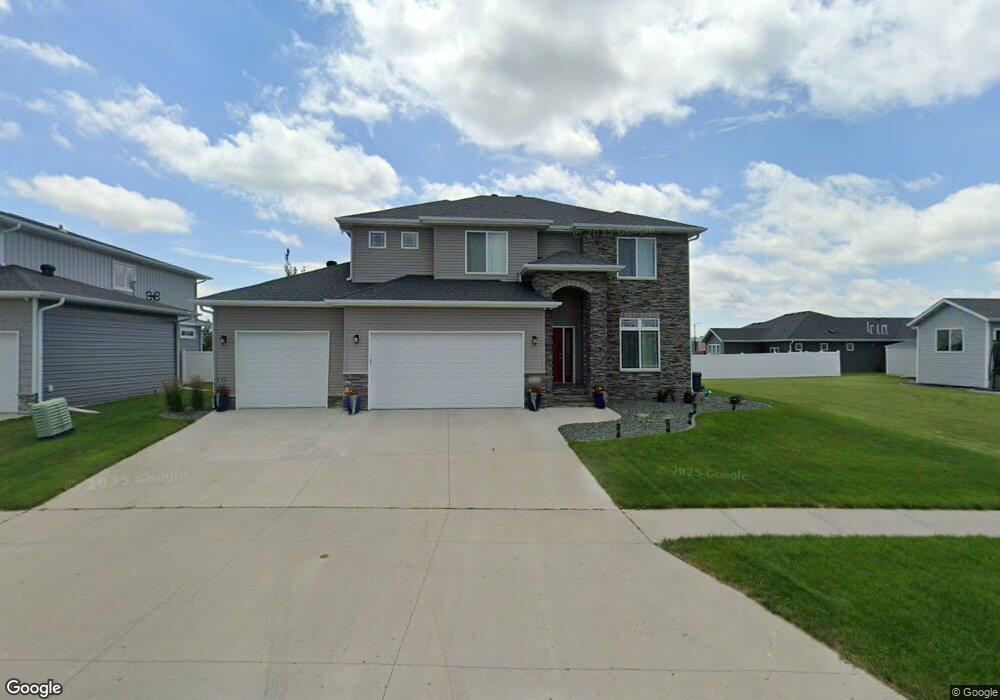
2040 69th Ave S Fargo, ND 58104
Davies NeighborhoodEstimated Value: $546,000 - $644,000
4
Beds
3
Baths
3,085
Sq Ft
$186/Sq Ft
Est. Value
About This Home
This home is located at 2040 69th Ave S, Fargo, ND 58104 and is currently estimated at $573,300, approximately $185 per square foot. 2040 69th Ave S is a home located in Cass County with nearby schools including Bennett Elementary School, Discovery Middle School, and Fargo Davies High School.
Ownership History
Date
Name
Owned For
Owner Type
Purchase Details
Closed on
Jul 10, 2018
Sold by
Lunak Robby B and Lunak Tracy L
Bought by
Beiswanger Stephanie A Roers and Beiswanger Matthew J
Current Estimated Value
Home Financials for this Owner
Home Financials are based on the most recent Mortgage that was taken out on this home.
Original Mortgage
$308,000
Outstanding Balance
$267,518
Interest Rate
4.6%
Mortgage Type
New Conventional
Estimated Equity
$305,782
Purchase Details
Closed on
May 15, 2015
Sold by
Anderson Justin R and Anderson Krista M
Bought by
Lunak Robby B and Lunak Tracy L
Home Financials for this Owner
Home Financials are based on the most recent Mortgage that was taken out on this home.
Original Mortgage
$328,410
Interest Rate
3.68%
Mortgage Type
New Conventional
Purchase Details
Closed on
May 16, 2014
Sold by
Crofton Coves Llc
Bought by
Anderson Justin R and Anderson Krista M
Home Financials for this Owner
Home Financials are based on the most recent Mortgage that was taken out on this home.
Original Mortgage
$276,560
Interest Rate
4.34%
Mortgage Type
Construction
Create a Home Valuation Report for This Property
The Home Valuation Report is an in-depth analysis detailing your home's value as well as a comparison with similar homes in the area
Home Values in the Area
Average Home Value in this Area
Purchase History
| Date | Buyer | Sale Price | Title Company |
|---|---|---|---|
| Beiswanger Stephanie A Roers | $385,000 | Plains Title Llc | |
| Lunak Robby B | $364,900 | None Available | |
| Anderson Justin R | $42,900 | Trn Abstract And Title |
Source: Public Records
Mortgage History
| Date | Status | Borrower | Loan Amount |
|---|---|---|---|
| Open | Beiswanger Stephanie A Roers | $308,000 | |
| Previous Owner | Lunak Robby B | $328,410 | |
| Previous Owner | Anderson Justin R | $276,560 |
Source: Public Records
Tax History Compared to Growth
Tax History
| Year | Tax Paid | Tax Assessment Tax Assessment Total Assessment is a certain percentage of the fair market value that is determined by local assessors to be the total taxable value of land and additions on the property. | Land | Improvement |
|---|---|---|---|---|
| 2024 | $10,508 | $265,900 | $48,250 | $217,650 |
| 2023 | $10,743 | $265,900 | $48,250 | $217,650 |
| 2022 | $10,206 | $243,450 | $43,000 | $200,450 |
| 2021 | $9,777 | $231,850 | $43,000 | $188,850 |
| 2020 | $9,032 | $206,600 | $43,000 | $163,600 |
| 2019 | $9,038 | $206,600 | $29,900 | $176,700 |
| 2018 | $8,967 | $206,600 | $29,900 | $176,700 |
| 2017 | $6,745 | $131,600 | $29,900 | $101,700 |
| 2016 | $6,433 | $131,600 | $29,900 | $101,700 |
| 2015 | $6,441 | $121,700 | $15,900 | $105,800 |
| 2014 | $391 | $150 | $150 | $0 |
Source: Public Records
Map
Nearby Homes
- 2024 69th Ave S
- 6922 21st St S
- 6954 21st St S
- 2002 69th Ave S
- 2031 69th Ave S
- 2069 69th Ave S
- 6891 21st St S
- 1956 69th Ave S
- 6955 21st St S
- 6931 21st St S
- 1959 69th Ave S
- 6866 21st St S
- 6873 21st St S
- 6962 23rd St S
- 6940 23rd St S
- 6844 21st St S
- 6907 Crofton Ln S
- 6924 23rd St S
- 6857 21st St S
- 6908 23rd St S