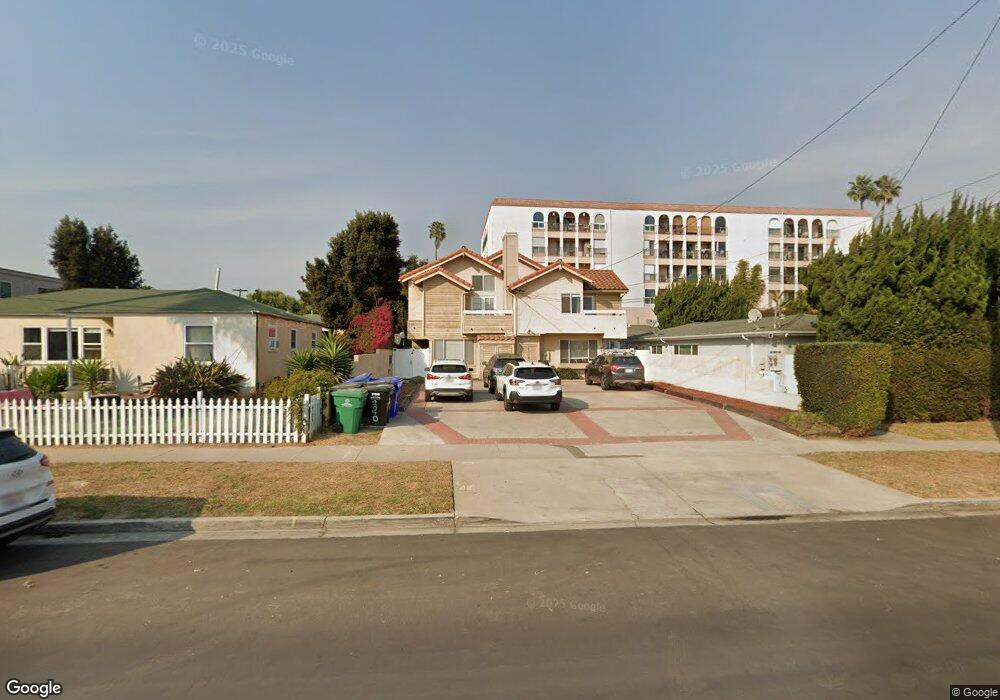
2040 Diamond St Unit 3 San Diego, CA 92109
Pacific Beach NeighborhoodEstimated Value: $773,000 - $892,000
2
Beds
3
Baths
1,100
Sq Ft
$741/Sq Ft
Est. Value
About This Home
This home is located at 2040 Diamond St Unit 3, San Diego, CA 92109 and is currently estimated at $814,776, approximately $740 per square foot. 2040 Diamond St Unit 3 is a home located in San Diego County with nearby schools including Sessions Elementary School, Pacific Beach Middle, and Mission Bay High School.
Ownership History
Date
Name
Owned For
Owner Type
Purchase Details
Closed on
Feb 24, 2012
Sold by
Canter Da Fund 1 Llc
Bought by
Nikolaidis Byron J and Nikolaidis Kathleen M
Current Estimated Value
Purchase Details
Closed on
Aug 31, 2011
Sold by
Kress Rebecca M
Bought by
Canter Da Fund I Llc
Purchase Details
Closed on
Jul 28, 2004
Sold by
Dibiase William J
Bought by
Kress Rebecca M
Home Financials for this Owner
Home Financials are based on the most recent Mortgage that was taken out on this home.
Original Mortgage
$360,000
Interest Rate
5.87%
Mortgage Type
Unknown
Purchase Details
Closed on
May 28, 2003
Sold by
Shutts Kenneth E and Shutts Jean
Bought by
Dibiase William J and Kress Rebecca M
Home Financials for this Owner
Home Financials are based on the most recent Mortgage that was taken out on this home.
Original Mortgage
$297,200
Interest Rate
4.87%
Mortgage Type
Unknown
Create a Home Valuation Report for This Property
The Home Valuation Report is an in-depth analysis detailing your home's value as well as a comparison with similar homes in the area
Home Values in the Area
Average Home Value in this Area
Purchase History
| Date | Buyer | Sale Price | Title Company |
|---|---|---|---|
| Nikolaidis Byron J | $320,000 | Ticor Title Company | |
| Canter Da Fund I Llc | $275,500 | None Available | |
| Kress Rebecca M | $35,000 | California Title Company | |
| Dibiase William J | $371,500 | Chicago Title Co |
Source: Public Records
Mortgage History
| Date | Status | Borrower | Loan Amount |
|---|---|---|---|
| Previous Owner | Kress Rebecca M | $360,000 | |
| Previous Owner | Dibiase William J | $297,200 | |
| Closed | Dibiase William J | $74,300 | |
| Closed | Kress Rebecca M | $67,500 |
Source: Public Records
Tax History Compared to Growth
Tax History
| Year | Tax Paid | Tax Assessment Tax Assessment Total Assessment is a certain percentage of the fair market value that is determined by local assessors to be the total taxable value of land and additions on the property. | Land | Improvement |
|---|---|---|---|---|
| 2025 | $4,871 | $401,923 | $276,230 | $125,693 |
| 2024 | $4,871 | $394,043 | $270,814 | $123,229 |
| 2023 | $4,764 | $386,317 | $265,504 | $120,813 |
| 2022 | $4,637 | $378,744 | $260,299 | $118,445 |
| 2021 | $4,606 | $371,319 | $255,196 | $116,123 |
| 2020 | $4,550 | $367,513 | $252,580 | $114,933 |
| 2019 | $4,469 | $360,308 | $247,628 | $112,680 |
| 2018 | $4,097 | $353,244 | $242,773 | $110,471 |
| 2017 | $3,998 | $346,318 | $238,013 | $108,305 |
| 2016 | $3,933 | $339,529 | $233,347 | $106,182 |
| 2015 | $3,874 | $334,430 | $229,842 | $104,588 |
| 2014 | $3,812 | $327,880 | $225,340 | $102,540 |
Source: Public Records
Map
Nearby Homes
- 4730 Noyes St Unit 106
- 4750 Noyes St Unit 110
- 2020 Diamond St Unit 12
- 2128 Missouri St
- 2002 Missouri St Unit 6
- 2036-38 Emerald St
- 2045 Emerald St Unit 3
- 2114 Felspar St
- 2050 Garnet Ave
- 4804 Lamont St
- 4600 Lamont St Unit 4-103
- 1978 Beryl St
- 1828 Diamond St Unit 3
- 1981 Wilbur Ave
- 1855 Diamond St Unit 201
- 1775 Diamond St Unit 220
- 1855 Diamond St Unit 5-309
- 1855 Diamond St Unit 228
- 2318 Chalcedony St
- 1885 Diamond St Unit 133
- 2040 Diamond St Unit 4
- 2040 Diamond St Unit 1
- 2040 Diamond St Unit 2
- 2048 Diamond St Unit 50
- 2032 Diamond St Unit 36
- 2066 Diamond St
- 2030 Diamond St
- 2072 Diamond St
- 4757 Academy Place
- 4730 Noyes St
- 4730 Noyes St Unit 419
- 4730 Noyes St Unit 415
- 4730 Noyes St Unit 412
- 4730 Noyes St Unit 410
- 4730 Noyes St Unit 218
- 4730 Noyes St Unit 217
- 4730 Noyes St Unit 216
- 4730 Noyes St Unit 215
- 4730 Noyes St Unit 213
- 4730 Noyes St Unit 212