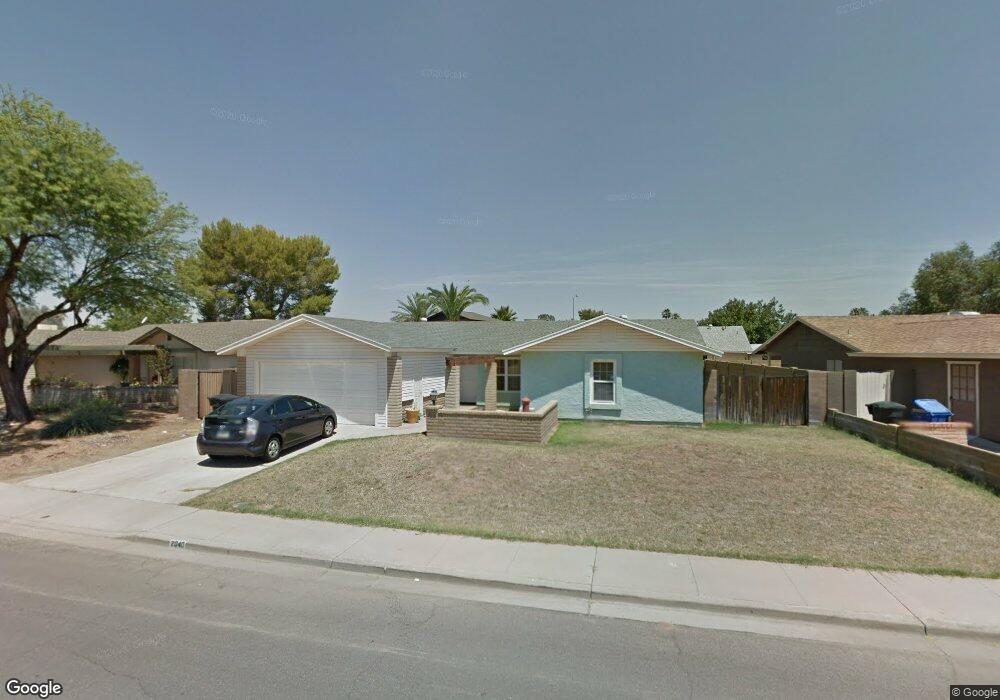
2040 E 7th Ave Mesa, AZ 85204
Central Mesa NeighborhoodEstimated Value: $352,663 - $463,000
3
Beds
2
Baths
1,579
Sq Ft
$268/Sq Ft
Est. Value
About This Home
This home is located at 2040 E 7th Ave, Mesa, AZ 85204 and is currently estimated at $422,916, approximately $267 per square foot. 2040 E 7th Ave is a home located in Maricopa County with nearby schools including Franklin at Brimhall Elementary School, Franklin West Elementary School, and Franklin Accelerated Academy Jordan Campus.
Ownership History
Date
Name
Owned For
Owner Type
Purchase Details
Closed on
May 8, 2013
Sold by
Tyson Glenn R and Tyson Diana L
Bought by
Tyson Glenn R
Current Estimated Value
Purchase Details
Closed on
May 19, 1997
Sold by
Adams Harry T and Adams Betty L
Bought by
Tyson Glenn R and Tyson Diana L
Home Financials for this Owner
Home Financials are based on the most recent Mortgage that was taken out on this home.
Original Mortgage
$97,400
Outstanding Balance
$13,502
Interest Rate
8.14%
Mortgage Type
VA
Estimated Equity
$409,414
Purchase Details
Closed on
Feb 14, 1995
Sold by
Hud
Bought by
Adams Mark C and Adams Harry T
Home Financials for this Owner
Home Financials are based on the most recent Mortgage that was taken out on this home.
Original Mortgage
$95,194
Interest Rate
9.27%
Mortgage Type
FHA
Create a Home Valuation Report for This Property
The Home Valuation Report is an in-depth analysis detailing your home's value as well as a comparison with similar homes in the area
Home Values in the Area
Average Home Value in this Area
Purchase History
| Date | Buyer | Sale Price | Title Company |
|---|---|---|---|
| Tyson Glenn R | -- | None Available | |
| Tyson Glenn R | $95,500 | Fidelity Title | |
| Adams Mark C | -- | -- |
Source: Public Records
Mortgage History
| Date | Status | Borrower | Loan Amount |
|---|---|---|---|
| Open | Tyson Glenn R | $97,400 | |
| Previous Owner | Adams Mark C | $95,194 |
Source: Public Records
Tax History
| Year | Tax Paid | Tax Assessment Tax Assessment Total Assessment is a certain percentage of the fair market value that is determined by local assessors to be the total taxable value of land and additions on the property. | Land | Improvement |
|---|---|---|---|---|
| 2025 | $1,498 | $15,183 | -- | -- |
| 2024 | $1,502 | $14,460 | -- | -- |
| 2023 | $1,502 | $30,950 | $6,190 | $24,760 |
| 2022 | $1,471 | $23,610 | $4,720 | $18,890 |
| 2021 | $1,489 | $22,610 | $4,520 | $18,090 |
| 2020 | $1,470 | $20,460 | $4,090 | $16,370 |
| 2019 | $1,373 | $18,360 | $3,670 | $14,690 |
| 2018 | $1,318 | $17,010 | $3,400 | $13,610 |
| 2017 | $1,279 | $15,380 | $3,070 | $12,310 |
| 2016 | $1,255 | $14,700 | $2,940 | $11,760 |
| 2015 | $1,180 | $13,820 | $2,760 | $11,060 |
Source: Public Records
Map
Nearby Homes
- 2036 E Marilyn Ave
- 2226 E Diamond Ave
- 1909 E 6th Ave
- 2210 E Edgewood Ave
- 763 S Alamo
- 2205 E El Moro Ave
- 1753 E Diamond Ave
- 1832 E Enid Ave
- 2124 E 3rd Dr
- 714 S Williams
- 2219 E Fairview Ave
- 2115 E Birchwood Ave
- 429 S Gaylord
- 2352 E Florian Cir
- 2127 E Bayberry Ave
- 628 S 26th St
- 546 S 26th St
- 522 S 26th St
- 335 S Harris Dr
- 643 S Winthrop
- 2046 E 7th Ave
- 2034 E 7th Ave
- 2037 E Marilyn Ave
- 2052 E 7th Ave
- 2028 E 7th Ave
- 2037 E 7th Ave
- 2043 E 7th Ave
- 2053 E Marilyn Ave
- 2029 E Marilyn Ave
- 2033 E 7th Ave
- 2049 E 7th Ave
- 2062 E 7th Ave
- 2027 E 7th Ave
- 2061 E Marilyn Ave
- 2024 E 7th Ave
- 2055 E 7th Ave
- 2021 E Marilyn Ave
- 2038 E Delta Ave
- 2042 E Delta Ave
- 2048 E Marilyn Ave
Your Personal Tour Guide
Ask me questions while you tour the home.