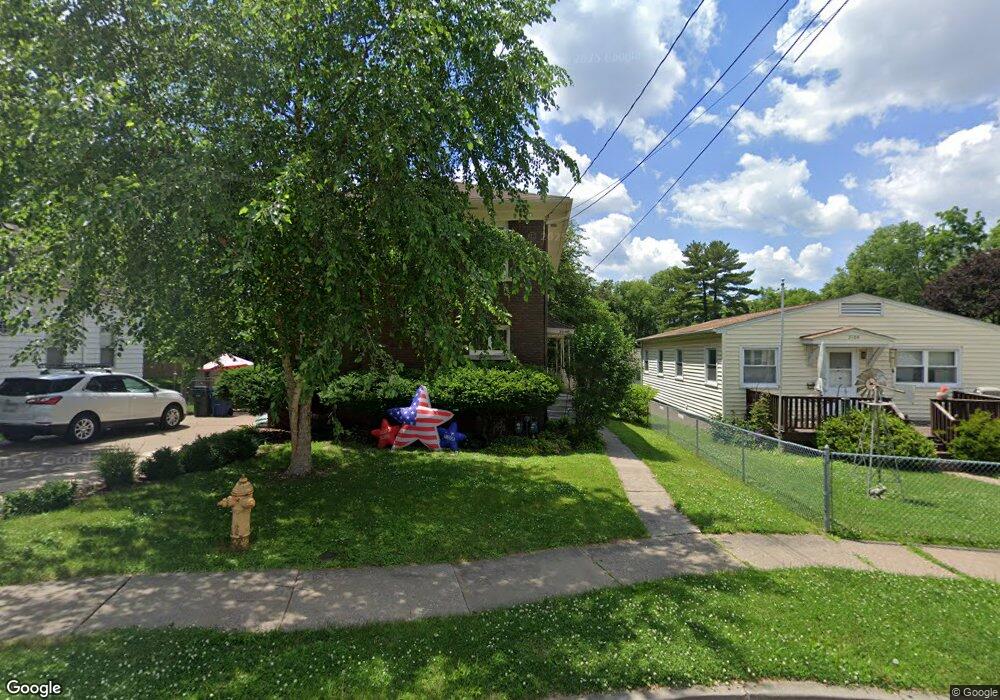
2040 Pershing Ave Davenport, IA 52803
Near North Side NeighborhoodEstimated Value: $153,000 - $175,000
3
Beds
2
Baths
2,080
Sq Ft
$79/Sq Ft
Est. Value
About This Home
This home is located at 2040 Pershing Ave, Davenport, IA 52803 and is currently estimated at $164,538, approximately $79 per square foot. 2040 Pershing Ave is a home located in Scott County with nearby schools including Crofton Elementary School, Christian County Day Treatment Center Alt, and Casey County Middle School.
Ownership History
Date
Name
Owned For
Owner Type
Purchase Details
Closed on
Jun 20, 2005
Sold by
Coppinger Chad A and Coppinger Jennifer E
Bought by
Vanhoosier Debra L
Current Estimated Value
Home Financials for this Owner
Home Financials are based on the most recent Mortgage that was taken out on this home.
Original Mortgage
$61,000
Outstanding Balance
$31,825
Interest Rate
5.75%
Mortgage Type
New Conventional
Estimated Equity
$132,713
Create a Home Valuation Report for This Property
The Home Valuation Report is an in-depth analysis detailing your home's value as well as a comparison with similar homes in the area
Home Values in the Area
Average Home Value in this Area
Purchase History
| Date | Buyer | Sale Price | Title Company |
|---|---|---|---|
| Vanhoosier Debra L | $95,000 | None Available |
Source: Public Records
Mortgage History
| Date | Status | Borrower | Loan Amount |
|---|---|---|---|
| Open | Vanhoosier Debra L | $61,000 |
Source: Public Records
Tax History Compared to Growth
Tax History
| Year | Tax Paid | Tax Assessment Tax Assessment Total Assessment is a certain percentage of the fair market value that is determined by local assessors to be the total taxable value of land and additions on the property. | Land | Improvement |
|---|---|---|---|---|
| 2025 | $1,876 | $171,730 | $24,640 | $147,090 |
| 2024 | $2,380 | $157,890 | $24,640 | $133,250 |
| 2023 | $2,480 | $157,890 | $24,640 | $133,250 |
| 2022 | $2,454 | $132,480 | $19,040 | $113,440 |
| 2021 | $2,454 | $126,060 | $19,040 | $107,020 |
| 2020 | $2,108 | $105,840 | $19,040 | $86,800 |
| 2019 | $2,124 | $103,180 | $19,040 | $84,140 |
| 2018 | $2,074 | $103,180 | $19,040 | $84,140 |
| 2017 | $574 | $103,180 | $19,040 | $84,140 |
| 2016 | $2,068 | $103,180 | $0 | $0 |
| 2015 | $2,068 | $108,960 | $0 | $0 |
| 2014 | $2,226 | $108,960 | $0 | $0 |
| 2013 | $2,378 | $0 | $0 | $0 |
| 2012 | -- | $108,960 | $16,910 | $92,050 |
Source: Public Records
Map
Nearby Homes
- 224 E Rusholme St
- 402 E Rusholme St
- 325 E Dover Ct
- 2211 Farnam St
- 2501 Brady St
- 2307 Farnam St
- 125 E Locust St
- 1812 Pershing Ave
- 625 E High St
- 2215 Grand Ave
- 2528 Farnam St
- 420 Kirkwood Blvd
- 618 Douglas Ct
- 2610 Farnam St
- 325 Kirkwood Blvd
- 511 Kirkwood Blvd
- 2506 N Harrison St Unit 2E
- 2118 Arlington Ave
- 2644 N Main St
- 11 Oak Ln
- 2104 Pershing Ave
- 2030 Pershing Ave
- 215 Pershing Ct
- 219 Pershing Ct
- 2020 Pershing Ave
- 211 Pershing Ct
- 304 E High St
- 2039 Pershing Ave
- 2029 Pershing Ave
- 207 Pershing Ct
- 214 Pershing Ct
- 2027 Pershing Ave
- 308 E High St
- 228 E Pleasant St
- 203 Pershing Ct
- 204 Pershing Ct
- 240 E Pleasant St
- 234 E Pleasant St
- 2023 Pershing Ave
- 220 E Pleasant St