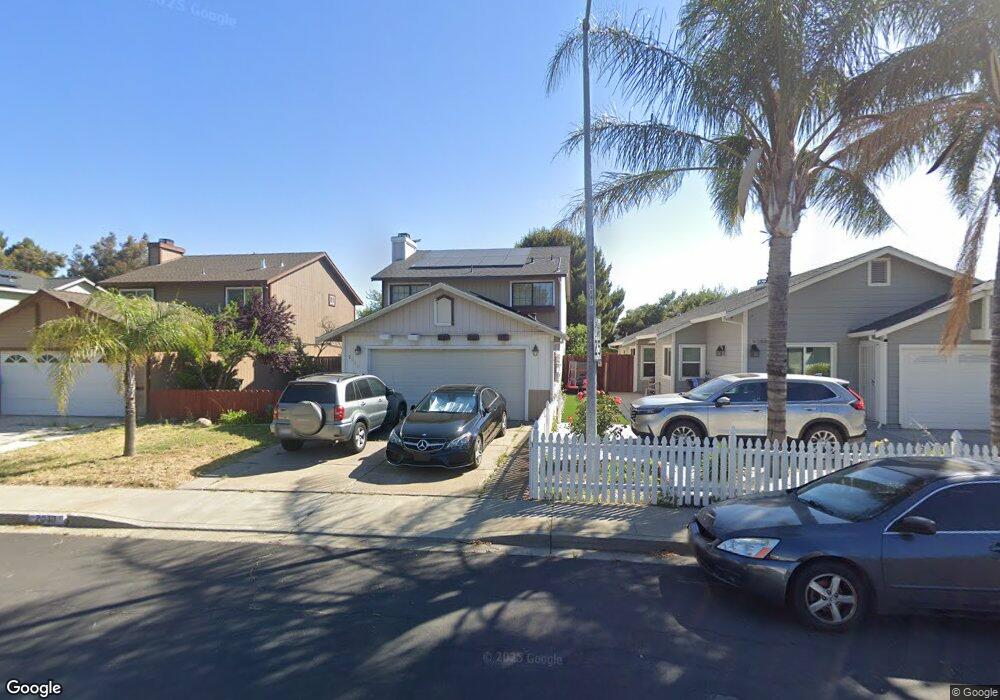
2040 Pomo St Bay Point, CA 94565
Estimated Value: $571,000 - $691,000
3
Beds
3
Baths
1,492
Sq Ft
$416/Sq Ft
Est. Value
About This Home
This home is located at 2040 Pomo St, Bay Point, CA 94565 and is currently estimated at $620,721, approximately $416 per square foot. 2040 Pomo St is a home located in Contra Costa County with nearby schools including Rio Vista Elementary School, Riverview Middle School, and Mt. Diablo High School.
Ownership History
Date
Name
Owned For
Owner Type
Purchase Details
Closed on
Apr 18, 2005
Sold by
Rivera Oscar
Bought by
Rivera Oscar
Current Estimated Value
Home Financials for this Owner
Home Financials are based on the most recent Mortgage that was taken out on this home.
Original Mortgage
$340,000
Outstanding Balance
$269,986
Interest Rate
7.01%
Mortgage Type
Stand Alone Refi Refinance Of Original Loan
Estimated Equity
$350,735
Purchase Details
Closed on
Aug 2, 1999
Sold by
Rivera Sonia A
Bought by
Rivera Oscar
Home Financials for this Owner
Home Financials are based on the most recent Mortgage that was taken out on this home.
Original Mortgage
$166,355
Interest Rate
7.64%
Mortgage Type
Purchase Money Mortgage
Purchase Details
Closed on
Apr 28, 1998
Sold by
Harper Burrows John and Harper Summer
Bought by
Burrows John H and Burrows Summer
Create a Home Valuation Report for This Property
The Home Valuation Report is an in-depth analysis detailing your home's value as well as a comparison with similar homes in the area
Home Values in the Area
Average Home Value in this Area
Purchase History
| Date | Buyer | Sale Price | Title Company |
|---|---|---|---|
| Rivera Oscar | -- | Alliance Title Company | |
| Rivera Oscar | -- | North American Title Co | |
| Rivera Oscar | $171,500 | North American Title Co | |
| Burrows John H | -- | -- |
Source: Public Records
Mortgage History
| Date | Status | Borrower | Loan Amount |
|---|---|---|---|
| Open | Rivera Oscar | $340,000 | |
| Closed | Rivera Oscar | $166,355 |
Source: Public Records
Tax History
| Year | Tax Paid | Tax Assessment Tax Assessment Total Assessment is a certain percentage of the fair market value that is determined by local assessors to be the total taxable value of land and additions on the property. | Land | Improvement |
|---|---|---|---|---|
| 2025 | $3,859 | $263,568 | $84,520 | $179,048 |
| 2024 | $3,662 | $258,401 | $82,863 | $175,538 |
| 2023 | $3,662 | $253,336 | $81,239 | $172,097 |
| 2022 | $3,636 | $248,370 | $79,647 | $168,723 |
| 2021 | $3,552 | $243,501 | $78,086 | $165,415 |
| 2019 | $3,458 | $236,280 | $75,771 | $160,509 |
| 2018 | $3,347 | $231,648 | $74,286 | $157,362 |
| 2017 | $3,245 | $227,107 | $72,830 | $154,277 |
| 2016 | $3,153 | $222,654 | $71,402 | $151,252 |
| 2015 | $3,119 | $219,311 | $70,330 | $148,981 |
| 2014 | $3,067 | $215,016 | $68,953 | $146,063 |
Source: Public Records
Map
Nearby Homes
- 215 San Bernardino Ct
- 3777 Willow Pass Rd Unit 85
- 3777 Willow Pass Rd Unit 20
- 744 Treasure Dr
- 55 Pacifica Ave Unit 49
- 55 Pacifica Ave Unit 77
- 55 Pacifica Ave Unit 90
- 55 Pacifica Ave Unit 146
- 621 Bounty Dr
- 417 Mystic Ln
- 97 Harbor Dr
- 93 Beach Dr
- 92 Beach Dr
- 87 Bay Dr
- 94 Anchor Dr
- 323 Rosemarie Place
- 28 Springbrook Ln
- 99 Enes Ave
- 43 Bay Dr
- 39 Canal Dr
Your Personal Tour Guide
Ask me questions while you tour the home.