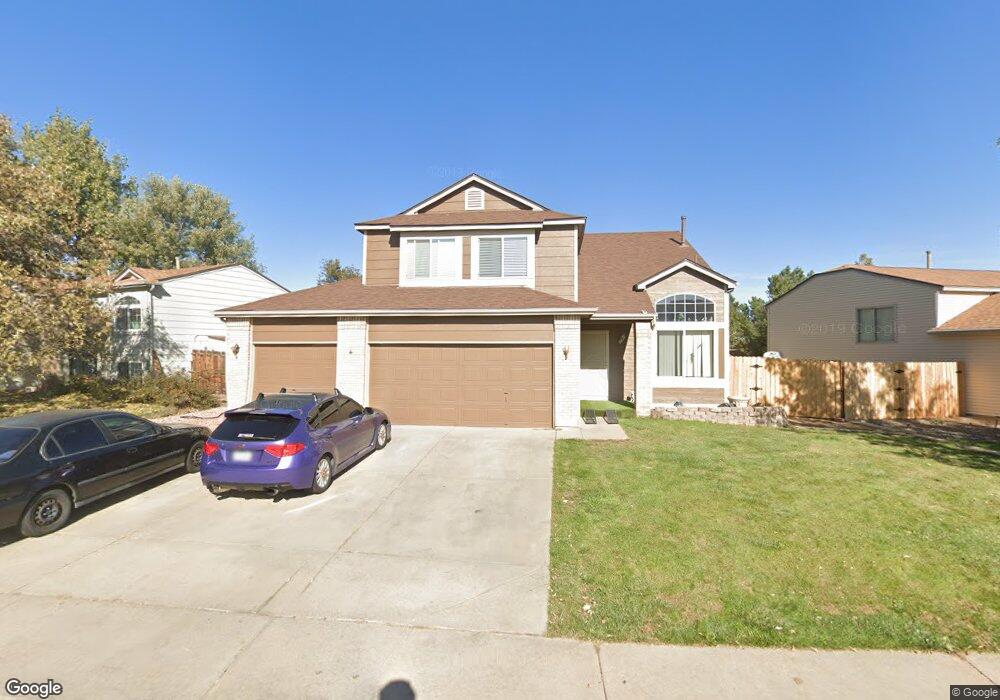
20403 E 44th Ave Denver, CO 80249
Green Valley Ranch NeighborhoodEstimated Value: $426,493 - $487,000
3
Beds
3
Baths
1,550
Sq Ft
$295/Sq Ft
Est. Value
About This Home
This home is located at 20403 E 44th Ave, Denver, CO 80249 and is currently estimated at $457,373, approximately $295 per square foot. 20403 E 44th Ave is a home located in Denver County with nearby schools including Green Valley Elementary School, Pitt-Waller K-8 School, and McGlone Academy.
Ownership History
Date
Name
Owned For
Owner Type
Purchase Details
Closed on
Mar 24, 2017
Sold by
Hernandez Noe
Bought by
Hernandez Bertha
Current Estimated Value
Purchase Details
Closed on
Feb 14, 2008
Sold by
Hud
Bought by
Hernandez Noe
Home Financials for this Owner
Home Financials are based on the most recent Mortgage that was taken out on this home.
Original Mortgage
$166,700
Outstanding Balance
$102,236
Interest Rate
5.88%
Mortgage Type
Purchase Money Mortgage
Estimated Equity
$355,137
Purchase Details
Closed on
Oct 3, 2007
Sold by
Wells Fargo Bank Na
Bought by
Hud
Purchase Details
Closed on
Sep 10, 2007
Sold by
Gutierrez Ruben and Gutierrez Javier
Bought by
Wells Fargo Bank Na
Purchase Details
Closed on
Oct 30, 2002
Sold by
Smith Stewart M and Smith Joan R
Bought by
Gutierrez Javier and Gutierrez Ruben
Home Financials for this Owner
Home Financials are based on the most recent Mortgage that was taken out on this home.
Original Mortgage
$197,214
Interest Rate
5.95%
Mortgage Type
FHA
Create a Home Valuation Report for This Property
The Home Valuation Report is an in-depth analysis detailing your home's value as well as a comparison with similar homes in the area
Home Values in the Area
Average Home Value in this Area
Purchase History
| Date | Buyer | Sale Price | Title Company |
|---|---|---|---|
| Hernandez Bertha | -- | None Available | |
| Hernandez Noe | $166,700 | None Available | |
| Hud | -- | None Available | |
| Wells Fargo Bank Na | -- | None Available | |
| Gutierrez Javier | $200,000 | Land Title Guarantee Company |
Source: Public Records
Mortgage History
| Date | Status | Borrower | Loan Amount |
|---|---|---|---|
| Open | Hernandez Noe | $166,700 | |
| Previous Owner | Gutierrez Javier | $197,214 |
Source: Public Records
Tax History
| Year | Tax Paid | Tax Assessment Tax Assessment Total Assessment is a certain percentage of the fair market value that is determined by local assessors to be the total taxable value of land and additions on the property. | Land | Improvement |
|---|---|---|---|---|
| 2025 | $2,802 | $33,200 | $6,010 | $6,010 |
| 2024 | $2,802 | $29,720 | $2,020 | $27,700 |
| 2023 | $2,660 | $29,720 | $2,020 | $27,700 |
| 2022 | $2,528 | $25,380 | $4,740 | $20,640 |
| 2021 | $2,474 | $26,120 | $4,880 | $21,240 |
| 2020 | $2,301 | $24,400 | $4,060 | $20,340 |
| 2019 | $2,250 | $24,400 | $4,060 | $20,340 |
| 2018 | $1,990 | $20,420 | $3,270 | $17,150 |
| 2017 | $1,985 | $20,420 | $3,270 | $17,150 |
| 2016 | $1,692 | $16,650 | $3,168 | $13,482 |
| 2015 | $1,635 | $16,650 | $3,168 | $13,482 |
| 2014 | $1,205 | $11,680 | $2,388 | $9,292 |
Source: Public Records
Map
Nearby Homes
- 20420 Kelly Place
- 20762 E 44th Ave
- 4201 Ireland St
- 4312 Kirk Ct
- 20000 Mitchell Place Unit 9
- 20644 E 47th Ave
- 20927 Kelly Place
- 20000 E Mitchell Place Unit 71
- 4531 Gibraltar St
- 20372 E 40th Place
- 20865 E 47th Ave
- 4632 Gibraltar St
- 20591 E 48th Place
- 20053 E 40th Ave
- 3880 N Jebel St
- 3953 Ireland St
- 20604 E 38th Place
- 20655 E 49th Ave
- 19037 E 64th Ave
- 3841 N Himalaya Rd Unit 1
- 20453 E 44th Ave
- 20393 E 44th Ave
- 20383 E 44th Ave
- 4394 Jebel St
- 20394 E 44th Ave
- 20392 E 44th Ave
- 4395 Jericho St
- 20363 E 44th Ave
- 20503 E 44th Ave
- 4384 Jebel St
- 20382 E 44th Ave
- 4383 Jebel St
- 4385 Jericho St
- 20343 E 44th Ave
- 20361 Kelly Place
- 20703 E 44th Ave
- 20352 E 44th Ave
- 4390 Jericho St
- 20341 Kelly Place
- 4374 Jebel St
Your Personal Tour Guide
Ask me questions while you tour the home.