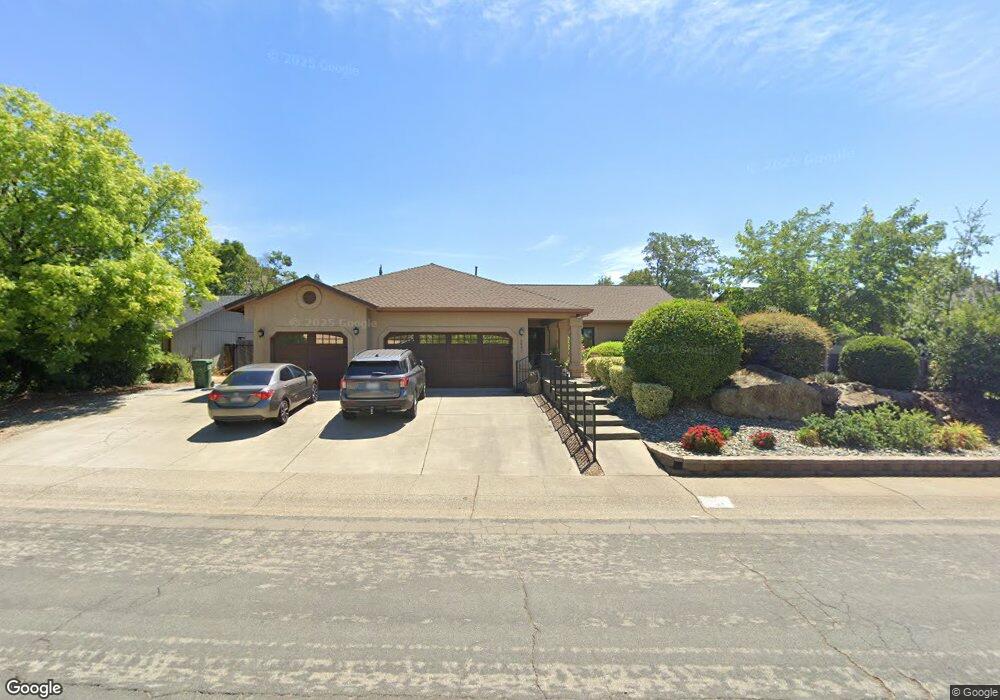
2041 O'Conner Redding, CA 96001
Mary Lake NeighborhoodEstimated Value: $418,657 - $451,000
4
Beds
3
Baths
2,189
Sq Ft
$198/Sq Ft
Est. Value
About This Home
This home is located at 2041 O'Conner, Redding, CA 96001 and is currently estimated at $433,414, approximately $197 per square foot. 2041 O'Conner is a home located in Shasta County with nearby schools including Manzanita Elementary School, Sequoia Middle School, and Shasta High School.
Ownership History
Date
Name
Owned For
Owner Type
Purchase Details
Closed on
Dec 10, 2018
Sold by
Brooks Marilyn R and Marilyn R Brooks Revocable Tru
Bought by
Cartwright Debra R
Current Estimated Value
Home Financials for this Owner
Home Financials are based on the most recent Mortgage that was taken out on this home.
Original Mortgage
$85,000
Outstanding Balance
$74,887
Interest Rate
4.8%
Mortgage Type
New Conventional
Estimated Equity
$358,527
Purchase Details
Closed on
Oct 6, 2009
Sold by
Brooks Marilyn
Bought by
Brooks Marilyn R and Marilyn R Brooks Revocable Tru
Purchase Details
Closed on
Jul 10, 2008
Sold by
Brooks Marilyn and The Brooks 2003 Revocable Trus
Bought by
Brooks Marilyn
Purchase Details
Closed on
Nov 24, 2003
Sold by
Brooks John J and Brooks Rebecca Gerolynn
Bought by
Brooks John Joseph and Gerolynn Brooks R
Purchase Details
Closed on
Mar 29, 2001
Sold by
Stockham Charles R and Stockham Betty
Bought by
Brooks John J and Brooks Rebecca Gerolyn
Create a Home Valuation Report for This Property
The Home Valuation Report is an in-depth analysis detailing your home's value as well as a comparison with similar homes in the area
Home Values in the Area
Average Home Value in this Area
Purchase History
| Date | Buyer | Sale Price | Title Company |
|---|---|---|---|
| Cartwright Debra R | $375,000 | Placer Title Co | |
| Brooks Marilyn R | -- | None Available | |
| Brooks Marilyn | -- | None Available | |
| Brooks John Joseph | -- | -- | |
| Brooks John J | $192,000 | Fidelity National Title Co |
Source: Public Records
Mortgage History
| Date | Status | Borrower | Loan Amount |
|---|---|---|---|
| Open | Cartwright Debra R | $85,000 |
Source: Public Records
Tax History
| Year | Tax Paid | Tax Assessment Tax Assessment Total Assessment is a certain percentage of the fair market value that is determined by local assessors to be the total taxable value of land and additions on the property. | Land | Improvement |
|---|---|---|---|---|
| 2025 | $1,241 | $117,410 | $8,568 | $108,842 |
| 2024 | $1,222 | $115,108 | $8,400 | $106,708 |
| 2023 | $1,222 | $112,852 | $8,236 | $104,616 |
| 2022 | $1,201 | $110,640 | $8,075 | $102,565 |
| 2021 | $1,195 | $108,471 | $7,917 | $100,554 |
| 2020 | $1,210 | $107,359 | $7,836 | $99,523 |
| 2019 | $1,149 | $103,192 | $7,533 | $95,659 |
| 2018 | $2,628 | $244,981 | $46,341 | $198,640 |
| 2017 | $2,612 | $240,179 | $45,433 | $194,746 |
| 2016 | $2,528 | $235,471 | $44,543 | $190,928 |
| 2015 | $2,495 | $231,935 | $43,874 | $188,061 |
| 2014 | $2,477 | $227,393 | $43,015 | $184,378 |
Source: Public Records
Map
Nearby Homes
- 1974 Kildare Dr
- 1783 Record Ln
- 1756 Mary Lake Dr
- 4395 Carlow Way
- 1846 Kildare Dr
- 4519 Nantucket Dr
- 4746 Tralee Ln
- 4125 Oro St
- 1695 Kildare Dr
- 1692 Kildare Dr
- 4160 Travona Ct
- 4065 Meander Dr
- 1513 Brinn Dr
- 3882 Fujiyama Way
- 16928 Campo Calle
- 2242 Everest Dr
- 4648 Kilkee Dr
- 1426 Gladstone Ct
- 0 Thompson Ln
- 1430 Ridge Dr
- 2041 Oconner Ave
- 2057 Oconner Ave
- 2057 O'Conner
- 2023 Oconner Ave
- 2064 Imelda Ct
- 2075 O'Connor Ave
- 2042 Imelda Ct
- 2005 Oconner Ave
- 2048 Oconner Ave
- 2076 Imelda Ct
- 2032 Oconner Ave
- 2065 Kildare Dr
- 2048 Oconner Ave
- 2014 Oconner Ave
- 2066 Oconner Ave
- 2188 Wicklow St
- 2117 Kildare Dr
- 2049 Kildare Dr
- 2031 Imelda Ct
- 2084 O'Conner
Your Personal Tour Guide
Ask me questions while you tour the home.