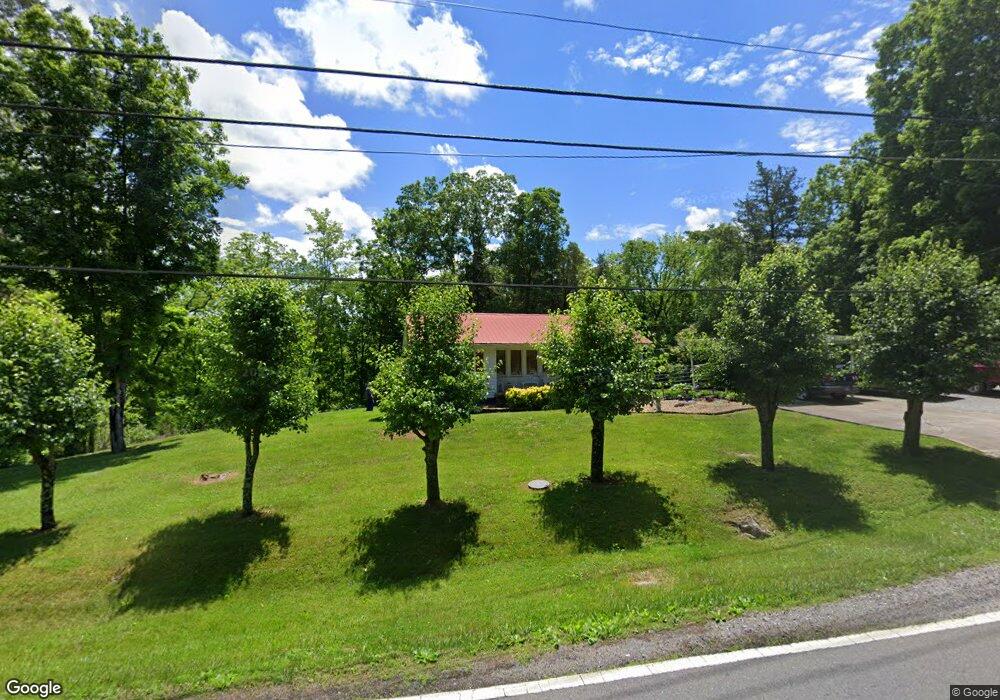
2041 Silver City Rd Russellville, TN 37860
Estimated Value: $147,744 - $227,000
--
Bed
1
Bath
981
Sq Ft
$191/Sq Ft
Est. Value
About This Home
This home is located at 2041 Silver City Rd, Russellville, TN 37860 and is currently estimated at $187,686, approximately $191 per square foot. 2041 Silver City Rd is a home located in Hamblen County with nearby schools including Russellville Elementary School, East Ridge Middle School, and Morristown East High School.
Ownership History
Date
Name
Owned For
Owner Type
Purchase Details
Closed on
Nov 10, 1998
Sold by
Estes Howard H and Estes Juanita
Bought by
Swiney Robbie
Current Estimated Value
Home Financials for this Owner
Home Financials are based on the most recent Mortgage that was taken out on this home.
Original Mortgage
$92,625
Outstanding Balance
$20,005
Interest Rate
6.47%
Estimated Equity
$167,681
Purchase Details
Closed on
Apr 11, 1997
Sold by
Estes Howard H and Estes Juanita
Bought by
Worley Quillen
Home Financials for this Owner
Home Financials are based on the most recent Mortgage that was taken out on this home.
Original Mortgage
$13,499
Interest Rate
7.85%
Purchase Details
Closed on
Jun 12, 1984
Bought by
Estes Howard Houston Ii & Lynetta
Purchase Details
Closed on
Jul 4, 1969
Bought by
Estes Howard H and Estes Juanita
Create a Home Valuation Report for This Property
The Home Valuation Report is an in-depth analysis detailing your home's value as well as a comparison with similar homes in the area
Home Values in the Area
Average Home Value in this Area
Purchase History
| Date | Buyer | Sale Price | Title Company |
|---|---|---|---|
| Swiney Robbie | $97,500 | -- | |
| Worley Quillen | $13,500 | -- | |
| Estes Howard Houston Ii & Lynetta | $25,000 | -- | |
| Estes Howard H | -- | -- |
Source: Public Records
Mortgage History
| Date | Status | Borrower | Loan Amount |
|---|---|---|---|
| Open | Estes Howard H | $92,625 | |
| Previous Owner | Estes Howard H | $13,499 | |
| Previous Owner | Estes Howard H | $61,500 |
Source: Public Records
Tax History Compared to Growth
Tax History
| Year | Tax Paid | Tax Assessment Tax Assessment Total Assessment is a certain percentage of the fair market value that is determined by local assessors to be the total taxable value of land and additions on the property. | Land | Improvement |
|---|---|---|---|---|
| 2024 | $348 | $17,675 | $4,575 | $13,100 |
| 2023 | $348 | $17,675 | $0 | $0 |
| 2022 | $348 | $17,675 | $4,575 | $13,100 |
| 2021 | $348 | $17,675 | $4,575 | $13,100 |
| 2020 | $348 | $17,675 | $4,575 | $13,100 |
| 2019 | $349 | $16,400 | $4,575 | $11,825 |
| 2018 | $349 | $16,400 | $4,575 | $11,825 |
| 2017 | $349 | $16,400 | $4,575 | $11,825 |
| 2016 | $326 | $16,400 | $4,575 | $11,825 |
| 2015 | $303 | $16,400 | $4,575 | $11,825 |
| 2014 | -- | $16,400 | $4,575 | $11,825 |
| 2013 | -- | $18,250 | $0 | $0 |
Source: Public Records
Map
Nearby Homes
- 1341 Little Mountain Rd
- 1290 Little Mountain Rd
- 5945 Union Grove Rd
- 1475 Shinbone Rd
- 1730 Silver City Rd
- Tract 3 Shinbone Rd
- Tract 4 Shinbone Rd
- 1976/1986 Shinbone Rd
- Tract 2 Shinbone Rd
- 5751 Charlene Dr
- LOT 1 5375 Fred Marshall Rd
- LOT 2 5375 Fred Marshall Rd
- 6899 Beacon Light Rd
- 7194 Mountain Valley Rd
- 7180 Mountain Valley Rd
- 7204 Mountain Valley Rd
- 814 Pullen Rd
- 1041 Wilburn Rd
- 2750 Mountain Rd
- 4271 Stansberry Rd
- 2040 Silver City Rd
- 2070 Silver City Rd
- 2070 Silver City Rd
- 2595 Little Mountain Rd
- 2090 Silver City Rd
- 2577 Little Mountain Rd
- 2020 Silver City Rd
- 2018 Silver City Rd
- 2292 Little Mountain Rd
- 2097 Silver City Rd
- 2016 Silver City Rd
- 2102 Silver City Rd
- 2275 Little Mountain Rd
- 2205 Little Mountain Rd Unit AUCTION
- 2205 Little Mountain Rd
- 2129 Silver City Rd
- 2014 Silver City Rd
- 2099 Silver City Rd
- 2139 Little Mountain Rd
- 2137 Silver City Rd