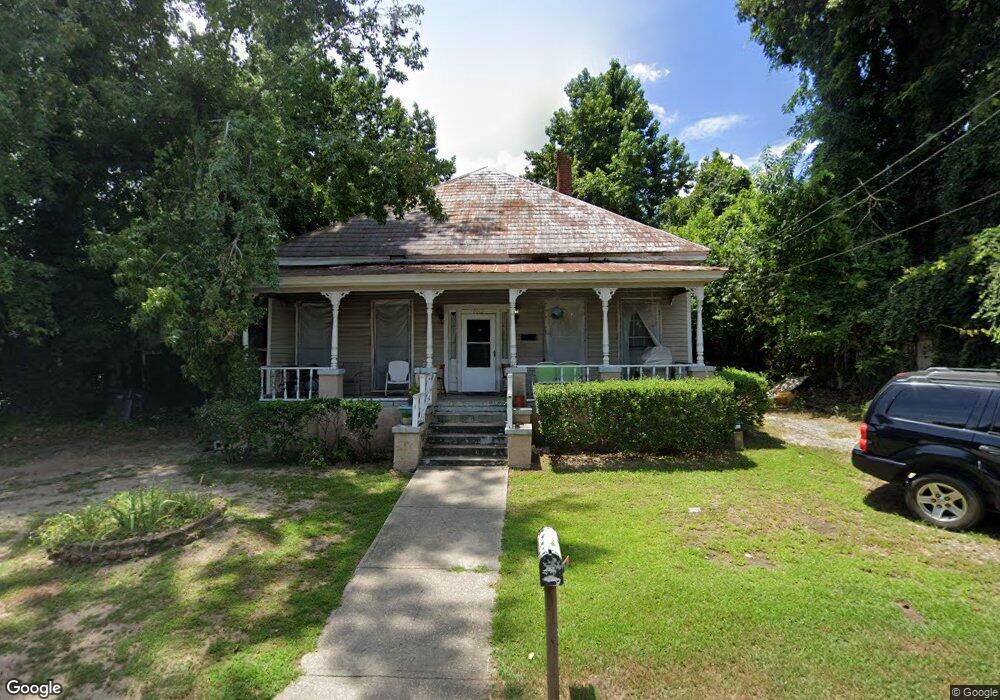
2042 Fenwick St Augusta, GA 30904
Harrisburg NeighborhoodEstimated Value: $119,000 - $163,000
3
Beds
2
Baths
1,836
Sq Ft
$76/Sq Ft
Est. Value
About This Home
This home is located at 2042 Fenwick St, Augusta, GA 30904 and is currently estimated at $139,973, approximately $76 per square foot. 2042 Fenwick St is a home located in Richmond County with nearby schools including Lamar Elementary School, W.S. Hornsby Elementary School, and Johnson Magnet.
Ownership History
Date
Name
Owned For
Owner Type
Purchase Details
Closed on
Jun 11, 2024
Sold by
Federal Home Loan Mortgage Corp
Bought by
Renovations Llc
Current Estimated Value
Purchase Details
Closed on
Jan 24, 2024
Sold by
Quicken Loans Llc
Bought by
Federal Home Loan Mortgage Corp
Purchase Details
Closed on
Dec 19, 2023
Sold by
Brown Charlene
Bought by
Quicken Loans Inc and Rocket Mortgage Llc
Purchase Details
Closed on
Nov 16, 2005
Sold by
Helms Ann H
Bought by
Brown Charlene
Home Financials for this Owner
Home Financials are based on the most recent Mortgage that was taken out on this home.
Original Mortgage
$77,130
Interest Rate
5.9%
Mortgage Type
Fannie Mae Freddie Mac
Purchase Details
Closed on
Aug 13, 2004
Sold by
Booher Richard Dwain
Bought by
Helms Ann H
Home Financials for this Owner
Home Financials are based on the most recent Mortgage that was taken out on this home.
Original Mortgage
$60,160
Interest Rate
5.96%
Mortgage Type
Purchase Money Mortgage
Purchase Details
Closed on
Mar 12, 2002
Sold by
Bailey John S
Bought by
Booher Richard Dwain
Create a Home Valuation Report for This Property
The Home Valuation Report is an in-depth analysis detailing your home's value as well as a comparison with similar homes in the area
Home Values in the Area
Average Home Value in this Area
Purchase History
| Date | Buyer | Sale Price | Title Company |
|---|---|---|---|
| Renovations Llc | $46,960 | -- | |
| Federal Home Loan Mortgage Corp | $60,200 | -- | |
| Quicken Loans Inc | $60,200 | -- | |
| Brown Charlene | $85,700 | -- | |
| Helms Ann H | $26,000 | -- | |
| Booher Richard Dwain | $11,000 | -- |
Source: Public Records
Mortgage History
| Date | Status | Borrower | Loan Amount |
|---|---|---|---|
| Previous Owner | Brown Charlene | $77,130 | |
| Previous Owner | Helms Ann H | $60,160 |
Source: Public Records
Tax History Compared to Growth
Tax History
| Year | Tax Paid | Tax Assessment Tax Assessment Total Assessment is a certain percentage of the fair market value that is determined by local assessors to be the total taxable value of land and additions on the property. | Land | Improvement |
|---|---|---|---|---|
| 2025 | $1,913 | $44,556 | $4,613 | $39,943 |
| 2024 | $1,913 | $24,080 | $2,240 | $21,840 |
| 2023 | $2,237 | $70,124 | $4,613 | $65,511 |
| 2022 | $1,641 | $43,509 | $4,613 | $38,896 |
| 2021 | $1,349 | $30,931 | $4,603 | $26,328 |
| 2020 | $1,156 | $25,588 | $3,960 | $21,628 |
| 2019 | $1,460 | $32,468 | $3,960 | $28,508 |
| 2018 | $1,471 | $32,468 | $3,960 | $28,508 |
| 2017 | $1,464 | $32,468 | $3,960 | $28,508 |
| 2016 | $1,465 | $32,468 | $3,960 | $28,508 |
| 2015 | $1,473 | $32,468 | $3,960 | $28,508 |
| 2014 | $1,474 | $32,468 | $3,960 | $28,508 |
Source: Public Records
Map
Nearby Homes
- 2015 Starnes St
- 2012 Starnes St
- 2008 Starnes St
- 1929 Watkins St
- 1968 Battle Row
- 542 Hickman Rd
- 1940 Starnes St
- 1938 Starnes St
- 1936 Starnes St
- 1934 Starnes St
- 729 Heard Ave
- 1915 Watkins St
- 1924 Fenwick St
- 705 Hickman Rd
- 1943 Heckle St
- 1917 Warren St
- 803 Russell St
- 605 Eve St
- 812 Russell St
- 1916 Walker St
- 2045 Fenwick St
- 2028 Battle Row
- 2032 Battle Row
- 2034 Battle Row
- 2045 Fenwick St
- 2040 Battle Row
- 2031 Fenwick St
- 2046 Battle Row
- 2046 Battle Row
- 2022 Battle Row
- 2020 Battle Row
- 2036 Fenwick St
- 2027 Fenwick St
- 2048 Battle Row
- 2048 Battle Row Unit D
- 2034 Fenwick St
- 2050 Battle Row
- 2045 Battle Row
- 2043 Starnes St
- 2041 Starnes St