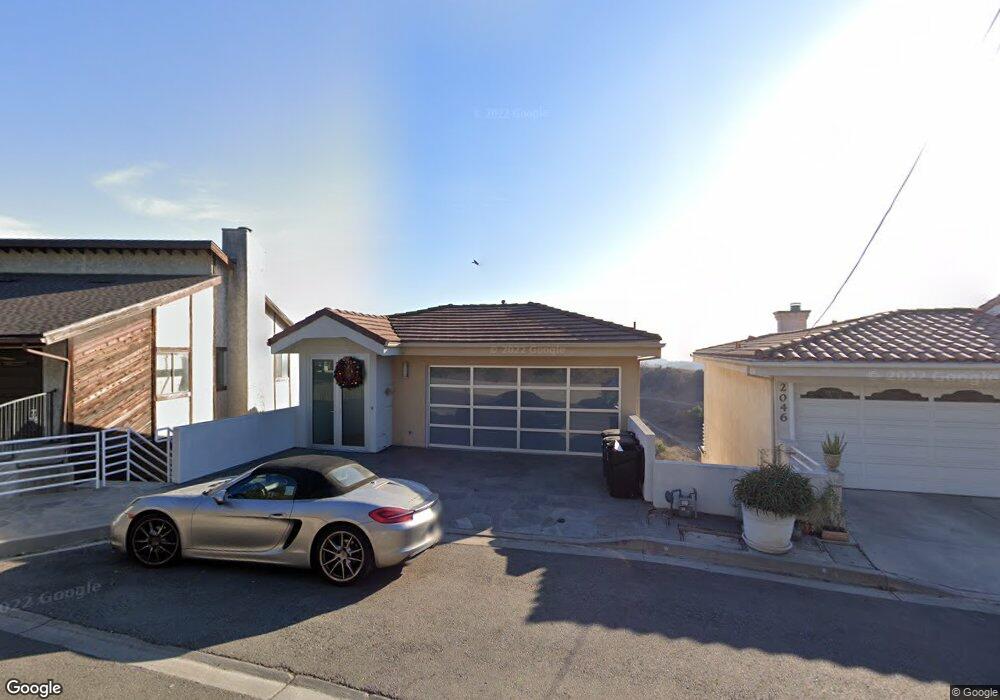
2042 Hanscom Dr South Pasadena, CA 91030
Estimated Value: $3,005,797 - $3,562,000
5
Beds
5
Baths
4,272
Sq Ft
$762/Sq Ft
Est. Value
About This Home
This home is located at 2042 Hanscom Dr, South Pasadena, CA 91030 and is currently estimated at $3,255,699, approximately $762 per square foot. 2042 Hanscom Dr is a home located in Los Angeles County with nearby schools including Monterey Hills Elementary, South Pasadena Middle School, and South Pasadena High School.
Ownership History
Date
Name
Owned For
Owner Type
Purchase Details
Closed on
May 2, 2024
Sold by
Yett Donald E
Bought by
Yett Boggan Trust and Yett
Current Estimated Value
Purchase Details
Closed on
Aug 4, 2023
Sold by
Boggan-Yett Celeste A
Bought by
Yett Donald E
Purchase Details
Closed on
Jun 29, 2023
Sold by
Pugh Yett Sally
Bought by
Donald E And Sally P Yett Family Trust and Yett
Purchase Details
Closed on
Aug 9, 2005
Sold by
Yett Donald E and Yett Sally P
Bought by
Yett Sally P and The Donald E & Sally P Yett Fa
Purchase Details
Closed on
May 24, 1999
Sold by
Al Baraka California Llc
Bought by
Yett Donald E and Yett Sally P
Home Financials for this Owner
Home Financials are based on the most recent Mortgage that was taken out on this home.
Original Mortgage
$200,000
Interest Rate
8.27%
Create a Home Valuation Report for This Property
The Home Valuation Report is an in-depth analysis detailing your home's value as well as a comparison with similar homes in the area
Home Values in the Area
Average Home Value in this Area
Purchase History
We collect this data history from publicly available records. To have your information removed, we recommend requesting removal directly through your county’s website.
| Date | Buyer | Sale Price | Title Company |
|---|---|---|---|
| Yett Boggan Trust | -- | None Listed On Document | |
| Yett Donald E | -- | None Listed On Document | |
| Donald E And Sally P Yett Family Trust | -- | None Listed On Document | |
| Yett Donald E | -- | Stewart Title Of California | |
| Donald E And Sally P Yett Family Trust | -- | -- | |
| Yett Sally P | -- | -- | |
| Yett Donald E | $400,000 | Chicago Title Co |
Source: Public Records
Mortgage History
We collect this data history from publicly available records. To have your information removed, we recommend requesting removal directly through your county’s website.
| Date | Status | Borrower | Loan Amount |
|---|---|---|---|
| Previous Owner | Yett Donald E | $200,000 |
Source: Public Records
Tax History
| Year | Tax Paid | Tax Assessment Tax Assessment Total Assessment is a certain percentage of the fair market value that is determined by local assessors to be the total taxable value of land and additions on the property. | Land | Improvement |
|---|---|---|---|---|
| 2025 | $32,575 | $2,845,800 | $1,938,000 | $907,800 |
| 2024 | $7,857 | $580,114 | $301,361 | $278,753 |
| 2023 | $7,245 | $568,740 | $295,452 | $273,288 |
| 2022 | $7,080 | $557,589 | $289,659 | $267,930 |
| 2021 | $6,933 | $546,657 | $283,980 | $262,677 |
| 2019 | $6,738 | $530,445 | $275,558 | $254,887 |
| 2018 | $6,547 | $520,045 | $270,155 | $249,890 |
| 2016 | $6,014 | $499,853 | $259,665 | $240,188 |
| 2015 | $5,905 | $492,346 | $255,765 | $236,581 |
| 2014 | $5,828 | $482,702 | $250,755 | $231,947 |
Source: Public Records
Map
Nearby Homes
- 2030 Hanscom Dr
- 2076 Hanscom Dr
- 2083 Hanscom Dr
- 2131 Hanscom Dr
- 4640 Harriman Ave
- 4648 Harriman Ave
- 4646 Harriman Ave
- 1836 Peterson Ave
- 1818 Peterson Ave
- 4314 Garden Homes Ave
- 898 Temple Terrace Unit 315
- 898 Temple Terrace Unit 125
- 809 Temple Terrace
- 1703 Hill Dr
- 3682 Harriman Ave Unit 3
- 3682 Harriman Ave Unit 2
- 3682 Harriman Ave Unit 1
- 3682 Harriman Ave Unit 4
- 4232 Locke Ave
- 4482 Richard Dr
- 2046 Hanscom Dr
- 2038 Hanscom Dr
- 2048 Hanscom Dr
- 2036 Hanscom Dr
- 2050 Hanscom Dr
- 2041 Hanscom Dr
- 2034 Hanscom Dr
- 2054 Hanscom Dr
- 2055 Hanscom Dr
- 2056 Hanscom Dr
- 2028 Hanscom Dr
- 2062 Hanscom Dr
- 2024 Hanscom Dr
- 2066 Hanscom Dr
- 2020 Hanscom Dr
- 4202 Pueblo Ave
- 4226 Pueblo Ave
- 4216 Pueblo Ave
- 4222 Pueblo Ave
- 4217 Pueblo Ave
Your Personal Tour Guide
Ask me questions while you tour the home.