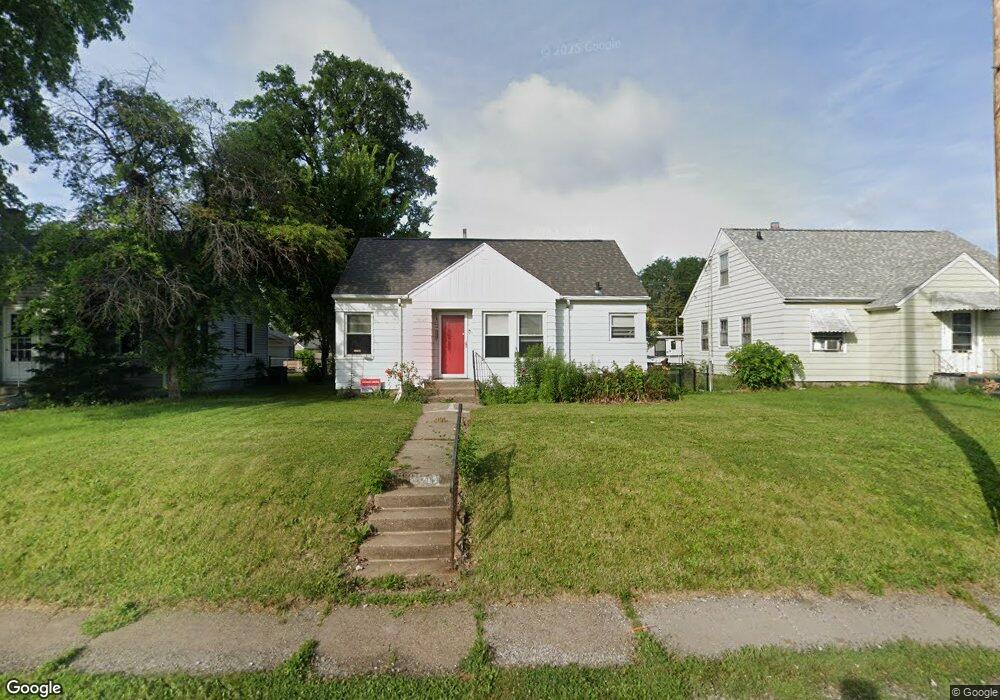
2042 Hickory Grove Rd Davenport, IA 52804
Northwest Davenport NeighborhoodEstimated Value: $138,000 - $155,000
3
Beds
1
Bath
986
Sq Ft
$147/Sq Ft
Est. Value
About This Home
This home is located at 2042 Hickory Grove Rd, Davenport, IA 52804 and is currently estimated at $144,921, approximately $146 per square foot. 2042 Hickory Grove Rd is a home located in Scott County with nearby schools including South Christian Elementary School, Wilson Elementary School, and Williams Intermediate School.
Ownership History
Date
Name
Owned For
Owner Type
Purchase Details
Closed on
Jun 12, 2013
Sold by
Yaddof Justin L and Yaddof Christine M
Bought by
Jcy Properties Llc
Current Estimated Value
Home Financials for this Owner
Home Financials are based on the most recent Mortgage that was taken out on this home.
Original Mortgage
$53,000
Outstanding Balance
$37,472
Interest Rate
3.43%
Mortgage Type
Future Advance Clause Open End Mortgage
Estimated Equity
$107,449
Purchase Details
Closed on
Nov 20, 2008
Sold by
Piasecki Vickie and Gardner Julie
Bought by
Yaddof Justin L and Yaddof Christine M
Home Financials for this Owner
Home Financials are based on the most recent Mortgage that was taken out on this home.
Original Mortgage
$58,800
Interest Rate
6.04%
Mortgage Type
Purchase Money Mortgage
Create a Home Valuation Report for This Property
The Home Valuation Report is an in-depth analysis detailing your home's value as well as a comparison with similar homes in the area
Home Values in the Area
Average Home Value in this Area
Purchase History
| Date | Buyer | Sale Price | Title Company |
|---|---|---|---|
| Jcy Properties Llc | -- | None Available | |
| Yaddof Justin L | $73,500 | None Available |
Source: Public Records
Mortgage History
| Date | Status | Borrower | Loan Amount |
|---|---|---|---|
| Open | Jcy Properties Llc | $53,000 | |
| Previous Owner | Yaddof Justin L | $58,800 |
Source: Public Records
Tax History Compared to Growth
Tax History
| Year | Tax Paid | Tax Assessment Tax Assessment Total Assessment is a certain percentage of the fair market value that is determined by local assessors to be the total taxable value of land and additions on the property. | Land | Improvement |
|---|---|---|---|---|
| 2025 | $2,086 | $126,750 | $18,400 | $108,350 |
| 2024 | $2,036 | $116,700 | $18,400 | $98,300 |
| 2023 | $2,082 | $116,700 | $18,400 | $98,300 |
| 2022 | $2,008 | $97,510 | $18,400 | $79,110 |
| 2021 | $2,008 | $93,580 | $18,400 | $75,180 |
| 2020 | $1,934 | $89,010 | $18,400 | $70,610 |
| 2019 | $1,954 | $87,050 | $18,400 | $68,650 |
| 2018 | $1,796 | $87,050 | $18,400 | $68,650 |
| 2017 | $455 | $81,820 | $18,400 | $63,420 |
| 2016 | $1,692 | $77,240 | $0 | $0 |
| 2015 | $1,692 | $82,690 | $0 | $0 |
| 2014 | $1,836 | $82,690 | $0 | $0 |
| 2013 | $1,804 | $0 | $0 | $0 |
| 2012 | -- | $77,970 | $17,520 | $60,450 |
Source: Public Records
Map
Nearby Homes
- 1723 W Locust St
- 1637 W Pleasant St
- 2103 W High St
- 1658 W Lombard St
- 2308 Wilkes Ave
- 2221 Madison St
- 2424 Davie St
- 1525 W High St
- 2223 W Lombard St
- 1517 W Lombard St
- 1922 N Pine St
- 1419 N Division St
- 2015 Washington St
- 2508 N Sturdevant St
- 2640 Wilkes Ave
- 1548 W Central Park Ave
- 1636 W Columbia Ave
- 2417 W 18th St
- 1505 W 14th St
- 2026 N Marquette St
- 2046 Hickory Grove Rd
- 2036 Hickory Grove Rd
- 2052 Hickory Grove Rd
- 2017 N Howell St
- 2032 Hickory Grove Rd
- 1837 W High St
- 2107 Frisco Dr
- 1816 W Pleasant St
- 1810 W Pleasant St
- 2022 Hickory Grove Rd
- 2040 N Howell St
- 2005 N Howell St
- 2025 Hickory Grove Rd
- 1823 W High St
- 2113 Frisco Dr
- 1804 W Pleasant St
- 2101 Hickory Grove Rd
- 1821 W High St
- 2117 Frisco Dr
- 2104 Wilkes Ave