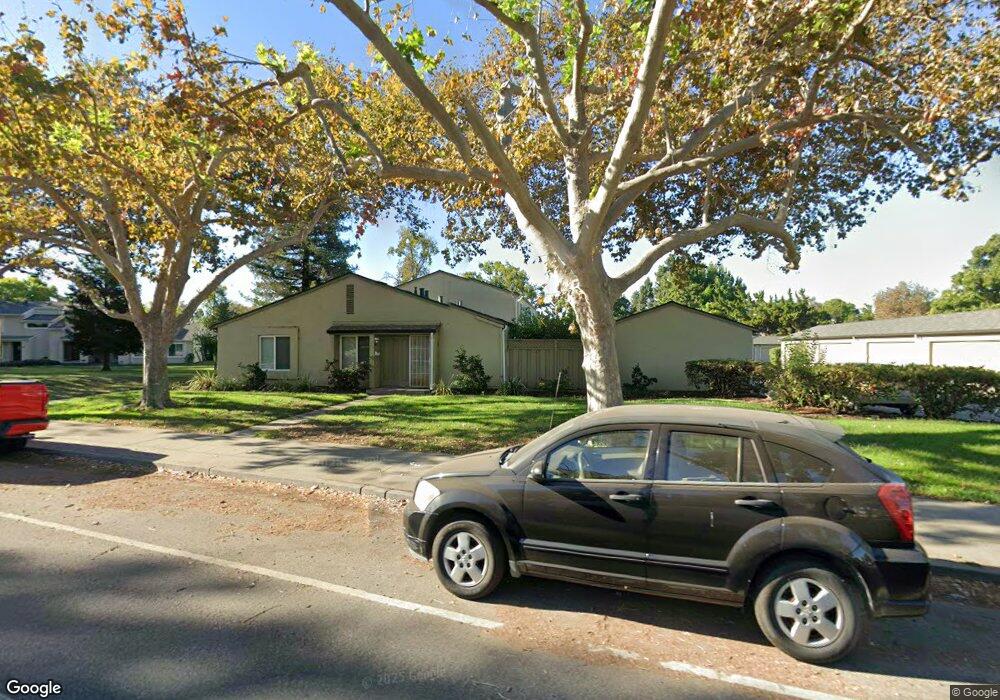
2042 Lunder Ct San Jose, CA 95131
Vinci NeighborhoodEstimated Value: $807,000 - $1,083,000
4
Beds
2
Baths
1,452
Sq Ft
$623/Sq Ft
Est. Value
About This Home
This home is located at 2042 Lunder Ct, San Jose, CA 95131 and is currently estimated at $905,190, approximately $623 per square foot. 2042 Lunder Ct is a home located in Santa Clara County with nearby schools including Vinci Park Elementary School, Morrill Middle School, and Independence High School.
Ownership History
Date
Name
Owned For
Owner Type
Purchase Details
Closed on
May 15, 2003
Sold by
Unpingco Segundo A and Unpingco Segundo P
Bought by
Jin Renchun and Wu Jianzhen
Current Estimated Value
Home Financials for this Owner
Home Financials are based on the most recent Mortgage that was taken out on this home.
Original Mortgage
$224,250
Outstanding Balance
$97,321
Interest Rate
5.77%
Mortgage Type
Purchase Money Mortgage
Estimated Equity
$807,869
Create a Home Valuation Report for This Property
The Home Valuation Report is an in-depth analysis detailing your home's value as well as a comparison with similar homes in the area
Home Values in the Area
Average Home Value in this Area
Purchase History
| Date | Buyer | Sale Price | Title Company |
|---|---|---|---|
| Jin Renchun | $345,000 | Financial Title Company |
Source: Public Records
Mortgage History
| Date | Status | Borrower | Loan Amount |
|---|---|---|---|
| Open | Jin Renchun | $224,250 |
Source: Public Records
Tax History
| Year | Tax Paid | Tax Assessment Tax Assessment Total Assessment is a certain percentage of the fair market value that is determined by local assessors to be the total taxable value of land and additions on the property. | Land | Improvement |
|---|---|---|---|---|
| 2025 | $7,695 | $499,656 | $199,860 | $299,796 |
| 2024 | $7,695 | $489,860 | $195,942 | $293,918 |
| 2023 | $7,541 | $480,255 | $192,100 | $288,155 |
| 2022 | $7,508 | $470,839 | $188,334 | $282,505 |
| 2021 | $7,252 | $461,608 | $184,642 | $276,966 |
| 2020 | $7,016 | $456,876 | $182,749 | $274,127 |
| 2019 | $6,746 | $447,918 | $179,166 | $268,752 |
| 2018 | $6,645 | $439,136 | $175,653 | $263,483 |
| 2017 | $6,675 | $430,526 | $172,209 | $258,317 |
| 2016 | $6,397 | $422,085 | $168,833 | $253,252 |
| 2015 | $6,320 | $415,745 | $166,297 | $249,448 |
| 2014 | $5,706 | $407,602 | $163,040 | $244,562 |
Source: Public Records
Map
Nearby Homes
- 1136 Ribisi Cir
- 1135 Pandolfi Place
- 1034 Ribisi Cir
- 1097 Ribisi Cir
- 1116 Oakbluff Ct
- 1252 Turrett Dr
- 1368 Goldenlake Rd
- 1729 Maysong Ct
- 2083 Bluejacket Way
- 2043 Shellback Place
- 2194 Celeste Ct
- 1131 Chen St
- 1146 Rosebriar Way
- 1153 Rosebriar Way
- 1683 Marco Way
- 1984 Doxey Dr
- 1291 Royal Crest Dr
- 1337 Araujo St
- 1712 Heavenly Bamboo Ct
- 1325 Araujo St
- 2044 Lunder Ct
- 2040 Lunder Ct
- 2046 Lunder Ct
- 2048 Lunder Ct
- 2041 Lunder Ct
- 2043 Lunder Ct
- 2045 Lunder Ct
- 2096 Swensen Ct
- 2038 Lunder Ct
- 2098 Swensen Ct
- 2047 Lunder Ct
- 2092 Swensen Ct
- 2036 Lunder Ct
- 2090 Swensen Ct
- 2049 Lunder Ct
- 2034 Lunder Ct
- 2088 Swensen Ct
- 2086 Swensen Ct
- 2032 Lunder Ct
- 2084 Swensen Ct
Your Personal Tour Guide
Ask me questions while you tour the home.