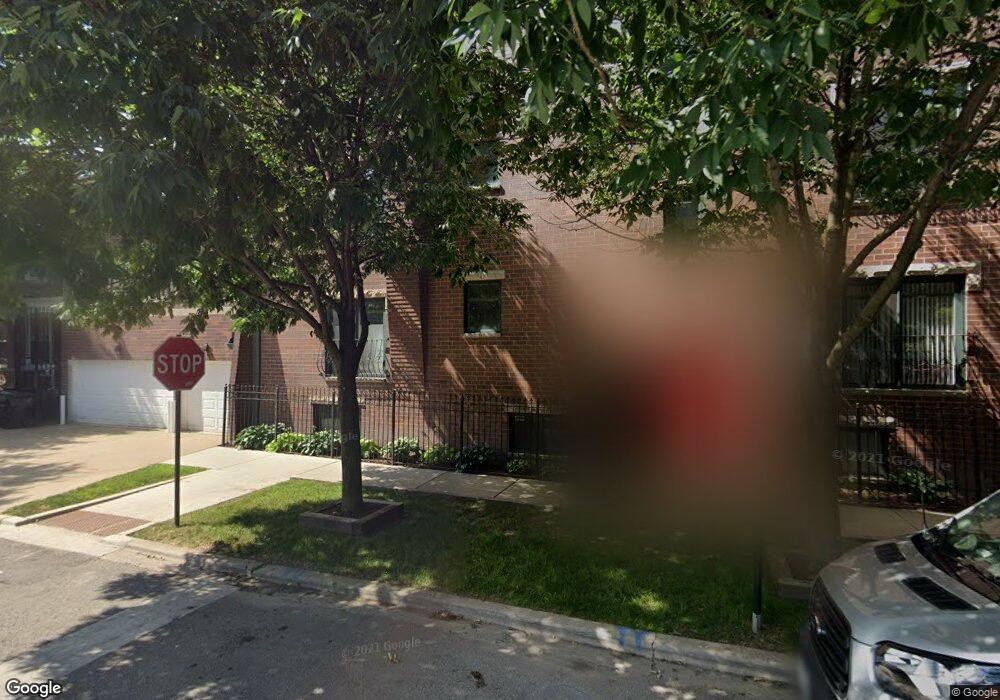
2042 N Point St Unit 1 Chicago, IL 60647
Logan Square NeighborhoodEstimated Value: $742,000 - $939,000
4
Beds
3
Baths
2,400
Sq Ft
$337/Sq Ft
Est. Value
About This Home
This home is located at 2042 N Point St Unit 1, Chicago, IL 60647 and is currently estimated at $807,745, approximately $336 per square foot. 2042 N Point St Unit 1 is a home located in Cook County with nearby schools including Chase Elementary School, Clemente Community Academy High School, and St. Sylvester School.
Ownership History
Date
Name
Owned For
Owner Type
Purchase Details
Closed on
Aug 13, 2021
Sold by
Haxel Daniel M and Haxel Morgan R
Bought by
Haxel Family Trust
Current Estimated Value
Purchase Details
Closed on
Jul 21, 2017
Sold by
Maliszewski Stephen P and Maliszewski Erin
Bought by
Haxel Daniel M and Haxel Morgan R
Home Financials for this Owner
Home Financials are based on the most recent Mortgage that was taken out on this home.
Original Mortgage
$421,500
Interest Rate
4%
Mortgage Type
New Conventional
Purchase Details
Closed on
Jul 23, 2008
Sold by
Christin Daniel and Christin Marny
Bought by
Maliszewski Stephen P and Maliszewski Erin
Home Financials for this Owner
Home Financials are based on the most recent Mortgage that was taken out on this home.
Original Mortgage
$345,000
Interest Rate
6.39%
Mortgage Type
Purchase Money Mortgage
Purchase Details
Closed on
May 21, 2008
Sold by
Christin Daniel
Bought by
Christin Daniel and Christin Marny
Create a Home Valuation Report for This Property
The Home Valuation Report is an in-depth analysis detailing your home's value as well as a comparison with similar homes in the area
Home Values in the Area
Average Home Value in this Area
Purchase History
| Date | Buyer | Sale Price | Title Company |
|---|---|---|---|
| Haxel Family Trust | -- | None Listed On Document | |
| Haxel Daniel M | $562,000 | First American Title | |
| Maliszewski Stephen P | $400,000 | Multiple | |
| Christin Daniel | -- | Chicago Title Insurance Co |
Source: Public Records
Mortgage History
| Date | Status | Borrower | Loan Amount |
|---|---|---|---|
| Previous Owner | Haxel Daniel M | $421,500 | |
| Previous Owner | Maliszewski Stephen P | $345,000 |
Source: Public Records
Tax History Compared to Growth
Tax History
| Year | Tax Paid | Tax Assessment Tax Assessment Total Assessment is a certain percentage of the fair market value that is determined by local assessors to be the total taxable value of land and additions on the property. | Land | Improvement |
|---|---|---|---|---|
| 2024 | $10,147 | $56,361 | $5,057 | $51,304 |
| 2023 | $9,869 | $51,240 | $2,303 | $48,937 |
| 2022 | $9,869 | $51,240 | $2,303 | $48,937 |
| 2021 | $9,665 | $51,238 | $2,302 | $48,936 |
| 2020 | $9,964 | $47,669 | $2,302 | $45,367 |
| 2019 | $9,939 | $52,721 | $2,302 | $50,419 |
| 2018 | $10,414 | $52,721 | $2,302 | $50,419 |
| 2017 | $7,792 | $39,571 | $2,031 | $37,540 |
| 2016 | $7,425 | $39,571 | $2,031 | $37,540 |
| 2015 | $6,771 | $39,571 | $2,031 | $37,540 |
| 2014 | $5,545 | $32,454 | $1,828 | $30,626 |
| 2013 | $5,424 | $32,454 | $1,828 | $30,626 |
Source: Public Records
Map
Nearby Homes
- 2771 W Francis Place Unit 305N
- 1935 N Fairfield Ave Unit 112
- 1934 N Washtenaw Ave Unit 103
- 2720 W Cortland St Unit P33
- 2706 W Cortland St Unit 3
- 2628 W Homer St
- 1925 N Francisco Ave
- 2118 N Bingham St
- 1841 N California Ave Unit 3B
- 2139 N Bingham St
- 2056 N Bingham St
- 2161 N California Ave Unit 105
- 2147 N Bingham St
- 2015 N Bingham St
- 1925 N Humboldt Blvd Unit P14
- 2009 N Bingham St
- 1816 N Rockwell St Unit C
- 2758 N Mozart St
- 2168 N Rockwell St
- 1742 N California Ave
- 2042 N Point St Unit 3
- 2042 N Point St Unit 2
- 2751 W Francis Place
- 2751 W Francis Place
- 2751 W Francis Place Unit 3
- 2751 W Francis Place Unit 1
- 2753 W Francis Place
- 2757 W Francis Place
- 2036 N Point St
- 3404 W Cortland St
- 2759 W Francis Place
- 2034 N Point St Unit 2
- 2034 N Point St
- 2738 W Francis Place
- 2736 W Francis Place Unit 1
- 2032 N Point St
- 2752 W Francis Place
- 2734 W Francis Place
- 2734 W Francis Place
- 2734 W Francis Place Unit 2