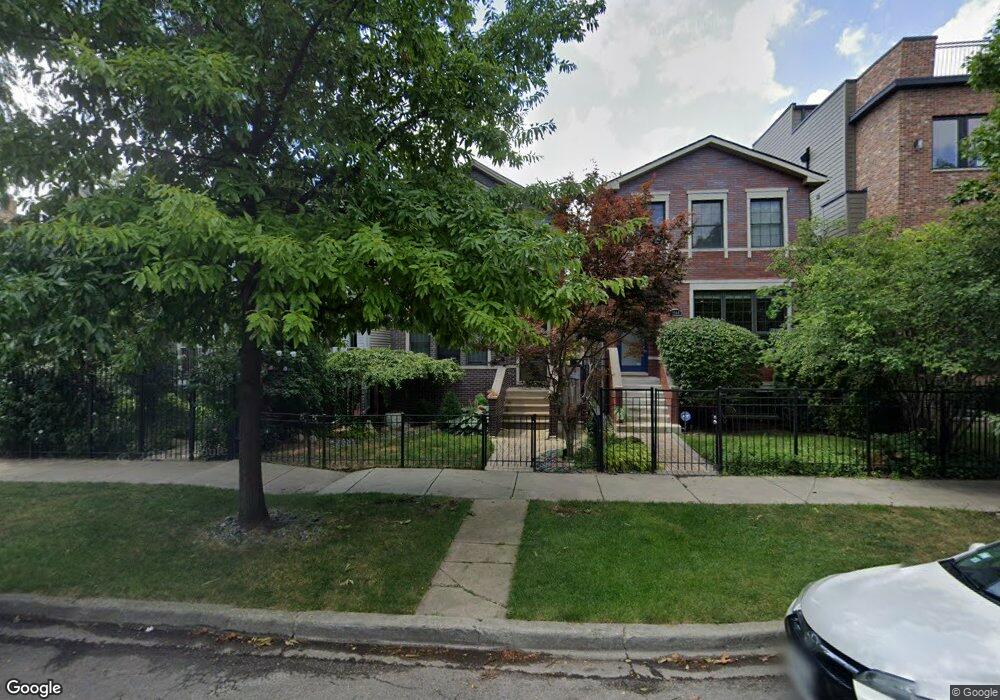
2042 N Whipple St Chicago, IL 60647
Logan Square NeighborhoodEstimated Value: $1,103,000 - $1,168,000
4
Beds
3
Baths
2,428
Sq Ft
$468/Sq Ft
Est. Value
About This Home
This home is located at 2042 N Whipple St, Chicago, IL 60647 and is currently estimated at $1,136,791, approximately $468 per square foot. 2042 N Whipple St is a home located in Cook County with nearby schools including Yates Elementary School, Clemente Community Academy High School, and St. Sylvester School.
Ownership History
Date
Name
Owned For
Owner Type
Purchase Details
Closed on
Jan 18, 2023
Sold by
Mcgrath Christopher
Bought by
Mcgrath Kelly
Current Estimated Value
Purchase Details
Closed on
Aug 9, 2006
Sold by
Mcgrath Christopher J and Mcgrath Kelly
Bought by
Mcgrath Christopher J and Mcgrath Kelly
Purchase Details
Closed on
Sep 21, 2004
Sold by
Mcgrath Christopher J
Bought by
Mcgrath Christopher J and Witkowski Kelly
Purchase Details
Closed on
Aug 11, 2004
Sold by
Chicago Title Land Trust Co
Bought by
Mcgrath Christopher J
Purchase Details
Closed on
May 21, 2002
Sold by
Birkmeyer Robert E
Bought by
Chicago Title Land Trust Company and Trust #1109652
Home Financials for this Owner
Home Financials are based on the most recent Mortgage that was taken out on this home.
Original Mortgage
$1,100,000
Interest Rate
4.75%
Create a Home Valuation Report for This Property
The Home Valuation Report is an in-depth analysis detailing your home's value as well as a comparison with similar homes in the area
Home Values in the Area
Average Home Value in this Area
Purchase History
| Date | Buyer | Sale Price | Title Company |
|---|---|---|---|
| Mcgrath Kelly | -- | None Listed On Document | |
| Mcgrath Christopher J | -- | None Available | |
| Mcgrath Christopher J | -- | Chicago Title Insurance Comp | |
| Mcgrath Christopher J | $635,000 | Cti | |
| Chicago Title Land Trust Company | $560,000 | -- |
Source: Public Records
Mortgage History
| Date | Status | Borrower | Loan Amount |
|---|---|---|---|
| Previous Owner | Chicago Title Land Trust Company | $1,100,000 |
Source: Public Records
Tax History Compared to Growth
Tax History
| Year | Tax Paid | Tax Assessment Tax Assessment Total Assessment is a certain percentage of the fair market value that is determined by local assessors to be the total taxable value of land and additions on the property. | Land | Improvement |
|---|---|---|---|---|
| 2024 | $14,332 | $100,000 | $21,000 | $79,000 |
| 2023 | $13,947 | $71,000 | $16,875 | $54,125 |
| 2022 | $13,947 | $71,000 | $16,875 | $54,125 |
| 2021 | $13,652 | $71,000 | $16,875 | $54,125 |
| 2020 | $13,772 | $64,700 | $9,562 | $55,138 |
| 2019 | $13,804 | $71,889 | $9,562 | $62,327 |
| 2018 | $14,303 | $75,844 | $9,562 | $66,282 |
| 2017 | $12,180 | $59,955 | $8,437 | $51,518 |
| 2016 | $11,508 | $59,955 | $8,437 | $51,518 |
| 2015 | $10,506 | $59,955 | $8,437 | $51,518 |
| 2014 | $8,570 | $48,761 | $7,500 | $41,261 |
| 2013 | $8,390 | $48,761 | $7,500 | $41,261 |
Source: Public Records
Map
Nearby Homes
- 2036 N Humboldt Blvd Unit 1E
- 2032 N Whipple St
- 2026 N Humboldt Blvd
- 2019 N Whipple St Unit 1
- 2014 N Whipple St
- 3060 W Armitage Ave
- 1949 N Whipple St Unit 1
- 3021 W Armitage Ave Unit 404
- 1943 N Whipple St
- 2139 N Kedzie Blvd Unit 2
- 2137 N Kedzie Blvd Unit G
- 1922 N Humboldt Blvd
- 2040 N Kedzie Ave Unit 2
- 1918 N Humboldt Blvd
- 1925 N Humboldt Blvd Unit P14
- 3019 W Lyndale St Unit 1
- 3019 W Lyndale St Unit 2
- 3219 W Dickens Ave
- 3115 W Lyndale St Unit 2
- 1922 N Richmond St
- 2038 N Whipple St
- 2044 N Whipple St
- 2036 N Whipple St
- 2046 N Whipple St
- 2034 N Whipple St
- 2048 N Whipple St
- 2048 N Whipple St Unit 2
- 2052 N Whipple St
- 2032 N Whipple St Unit 1
- 2054 N Whipple St
- 2030 N Whipple St
- 2026 N Whipple St
- 2043 N Albany Ave
- 2039 N Albany Ave
- 2039 N Albany Ave Unit 1
- 2033 N Albany Ave
- 2033 N Albany Ave
- 2033 N Albany Ave Unit 1
- 2037 N Albany Ave
- 2047 N Albany Ave