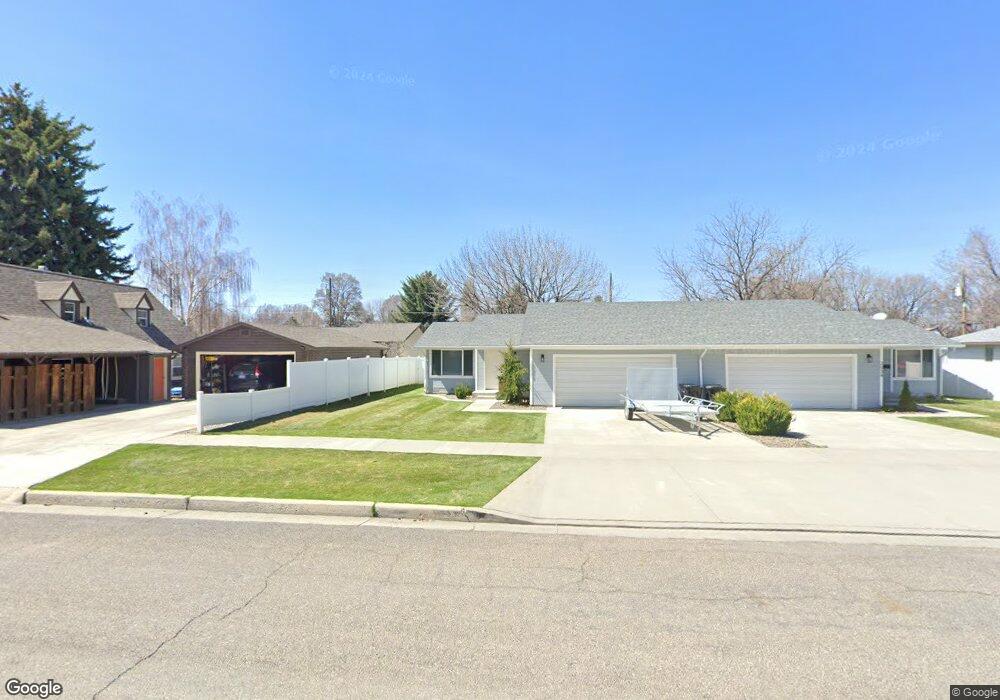
2042 Oakley Ave Burley, ID 83318
Estimated Value: $218,000 - $268,000
2
Beds
1
Bath
1,026
Sq Ft
$227/Sq Ft
Est. Value
About This Home
This home is located at 2042 Oakley Ave, Burley, ID 83318 and is currently estimated at $232,817, approximately $226 per square foot. 2042 Oakley Ave is a home located in Cassia County with nearby schools including White Pine Elementary School, Mountain View Elementary School, and Burley Junior High School.
Ownership History
Date
Name
Owned For
Owner Type
Purchase Details
Closed on
Mar 28, 2025
Sold by
Taylor Ty Kimberly and Taylor Kimberly
Bought by
Modern Space Re Llc
Current Estimated Value
Purchase Details
Closed on
Jun 16, 2014
Sold by
Taylor Ty and Taylor Kimberly
Bought by
Taylor Revocable Living Trust
Purchase Details
Closed on
Jan 17, 2014
Sold by
Brown Betty
Bought by
Taylor Ty and Taylor Kimberly
Home Financials for this Owner
Home Financials are based on the most recent Mortgage that was taken out on this home.
Original Mortgage
$70,000
Interest Rate
4.46%
Mortgage Type
New Conventional
Purchase Details
Closed on
Jul 16, 2010
Sold by
Mccord Roberta
Bought by
Brown Betty
Purchase Details
Closed on
Jul 3, 2006
Sold by
Maccord Robert
Bought by
Mccord Roberta
Create a Home Valuation Report for This Property
The Home Valuation Report is an in-depth analysis detailing your home's value as well as a comparison with similar homes in the area
Home Values in the Area
Average Home Value in this Area
Purchase History
| Date | Buyer | Sale Price | Title Company |
|---|---|---|---|
| Modern Space Re Llc | -- | None Listed On Document | |
| Taylor Revocable Living Trust | -- | None Available | |
| Taylor Ty | -- | Land Title And Escrow | |
| Brown Betty | -- | -- | |
| Mccord Roberta | -- | None Available |
Source: Public Records
Mortgage History
| Date | Status | Borrower | Loan Amount |
|---|---|---|---|
| Previous Owner | Taylor Ty | $70,000 | |
| Previous Owner | Mccord Roberta | $16,000 | |
| Previous Owner | Mccord Roberta | $6,000 |
Source: Public Records
Tax History Compared to Growth
Tax History
| Year | Tax Paid | Tax Assessment Tax Assessment Total Assessment is a certain percentage of the fair market value that is determined by local assessors to be the total taxable value of land and additions on the property. | Land | Improvement |
|---|---|---|---|---|
| 2024 | $1,550 | $198,124 | $47,840 | $150,284 |
| 2023 | $1,594 | $198,124 | $47,840 | $150,284 |
| 2022 | $1,726 | $161,399 | $34,040 | $127,359 |
| 2021 | $1,769 | $127,673 | $25,515 | $102,158 |
| 2020 | $1,510 | $98,578 | $10,581 | $87,997 |
| 2019 | $1,481 | $95,422 | $9,983 | $85,439 |
| 2017 | $1,425 | $88,597 | $9,075 | $79,522 |
| 2016 | $1,381 | $86,281 | $9,075 | $77,206 |
| 2015 | $1,370 | $85,456 | $8,250 | $77,206 |
| 2014 | $719 | $85,456 | $8,250 | $77,206 |
| 2013 | $719 | $85,654 | $8,250 | $77,404 |
Source: Public Records
Map
Nearby Homes
- 201 W 19th St
- 1942 Burton Ave
- 2140 Daven Place
- 2431 Dorchester Ave
- 1719 Burton Ave
- 2435 Oakley Ave Unit Burley, ID
- 320 E 23rd Dr
- 590 W 24th St
- 1729 Yale Ave
- 628 W 24th St
- 1610 Burton Ave
- 500 E 19th St
- 1600 Hansen Ave
- 600 Oxford St
- 550 Oxford St
- 2593 Burton Ave
- 1501 Miller Ave Unit 3
- 2339 Bristol Ave
- 2441 Dorchester Ave
- 2349 Bristol Ave