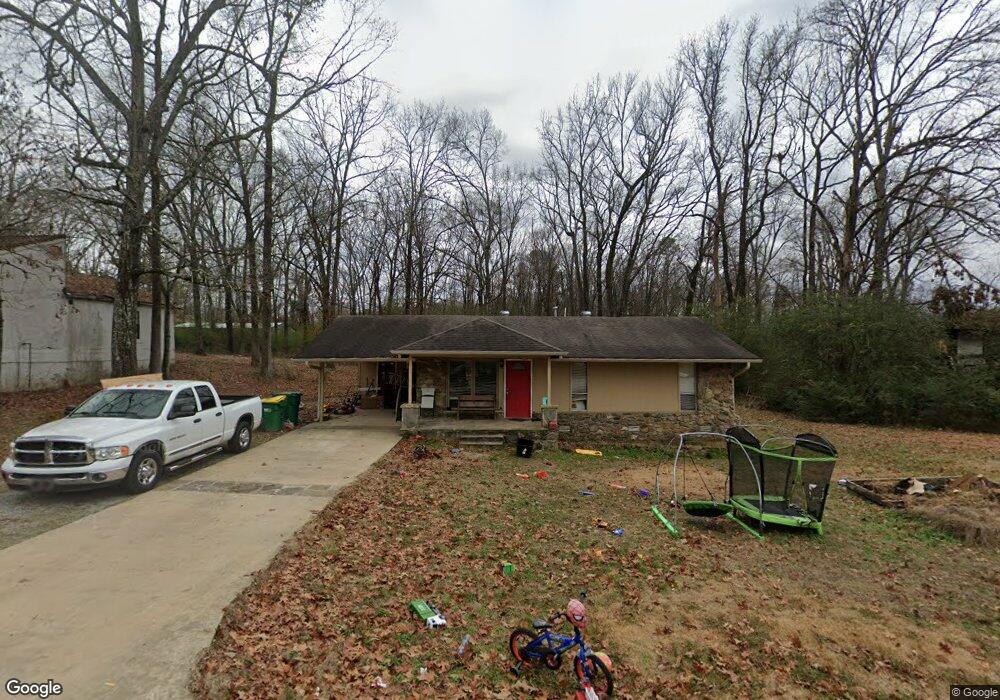
20423 Marks Dr Little Rock, AR 72210
Western Little Rock NeighborhoodEstimated Value: $101,000 - $155,000
--
Bed
1
Bath
1,069
Sq Ft
$124/Sq Ft
Est. Value
About This Home
This home is located at 20423 Marks Dr, Little Rock, AR 72210 and is currently estimated at $132,293, approximately $123 per square foot. 20423 Marks Dr is a home located in Pulaski County with nearby schools including Lawson Elementary School, Joe T. Robinson Middle School, and Joe T. Robinson High School.
Ownership History
Date
Name
Owned For
Owner Type
Purchase Details
Closed on
Dec 29, 2015
Sold by
Secretary Of Housing & Urban Development
Bought by
Guardado Francisco
Current Estimated Value
Purchase Details
Closed on
Jul 27, 2015
Sold by
U S Bank National Association
Bought by
Secretary Of Housing & Urban Development
Purchase Details
Closed on
Oct 15, 2013
Sold by
Hardin Robert Matthew
Bought by
Us Bank National Association
Purchase Details
Closed on
Sep 14, 2007
Sold by
Dickson Edward D
Bought by
Hardin Robert Matthew
Home Financials for this Owner
Home Financials are based on the most recent Mortgage that was taken out on this home.
Original Mortgage
$85,655
Interest Rate
6.63%
Mortgage Type
VA
Purchase Details
Closed on
Aug 30, 2000
Sold by
Moseley Rae
Bought by
Dickson Edward D
Home Financials for this Owner
Home Financials are based on the most recent Mortgage that was taken out on this home.
Original Mortgage
$63,700
Interest Rate
8.16%
Mortgage Type
VA
Create a Home Valuation Report for This Property
The Home Valuation Report is an in-depth analysis detailing your home's value as well as a comparison with similar homes in the area
Home Values in the Area
Average Home Value in this Area
Purchase History
| Date | Buyer | Sale Price | Title Company |
|---|---|---|---|
| Guardado Francisco | -- | None Available | |
| Secretary Of Housing & Urban Development | -- | Attorney | |
| Us Bank National Association | $59,705 | None Available | |
| Hardin Robert Matthew | $87,000 | American Abstract & Title Co | |
| Dickson Edward D | $64,000 | Lenders Title Company |
Source: Public Records
Mortgage History
| Date | Status | Borrower | Loan Amount |
|---|---|---|---|
| Previous Owner | Hardin Robert Matthew | $85,655 | |
| Previous Owner | Dickson Edward D | $63,700 |
Source: Public Records
Tax History Compared to Growth
Tax History
| Year | Tax Paid | Tax Assessment Tax Assessment Total Assessment is a certain percentage of the fair market value that is determined by local assessors to be the total taxable value of land and additions on the property. | Land | Improvement |
|---|---|---|---|---|
| 2025 | $1,080 | $22,115 | $4,600 | $17,515 |
| 2024 | $926 | $22,115 | $4,600 | $17,515 |
| 2023 | $926 | $22,115 | $4,600 | $17,515 |
| 2022 | $898 | $22,115 | $4,600 | $17,515 |
| 2021 | $821 | $15,180 | $1,600 | $13,580 |
| 2020 | $821 | $15,180 | $1,600 | $13,580 |
| 2019 | $821 | $15,180 | $1,600 | $13,580 |
| 2018 | $821 | $15,180 | $1,600 | $13,580 |
| 2017 | $821 | $15,180 | $1,600 | $13,580 |
| 2016 | $704 | $13,860 | $2,600 | $11,260 |
| 2015 | $655 | $12,902 | $2,600 | $10,302 |
| 2014 | $655 | $0 | $0 | $0 |
Source: Public Records
Map
Nearby Homes
- 20201 Running Creek Dr
- Lot 7 Waterview Estates
- 20700 Lisa Dr
- 18821 Lochridge Dr
- 16011 Burleigh Ct
- 16025 Burleigh Ct
- 15109 Angus Ct
- 15108 Angus Ct
- Lot 6 Faulkner Rd
- Lot 7 Faulkner Rd
- Lot 5 Faulkner Rd
- 18712 Lochridge Dr
- 2341 Still Hollow Trail
- 3601 Jack Mann Rd
- 000 Sparks Rd
- 3209 Jack Mann Rd
- 2301 Beauchamp Rd
- 19229 Colonel Glenn Rd
- 18100 Raines Rd
- 18100 - 003 Raines Rd
- 20425 Marks Dr
- 20403 Marks Dr
- 20420 Marks Dr
- 20401 Marks Dr
- 20400 Marks Dr
- 4800 Yvonne St
- 4623 Yvonne St
- 20225 Marks Dr
- 4610 Yvonne St
- 4609 Yvonne St
- 4824 Yvonne St
- 0 Yvonne St Unit 18001982
- 4607 Yvonne St
- 20200 Marks Dr
- 4624 Jacqueline Dr
- 4500 Jacqueline Dr
- 20021 Lawson Rd
- 4425 Jacqueline Dr
- 4901 Yvonne St
- 4909 Yvonne St