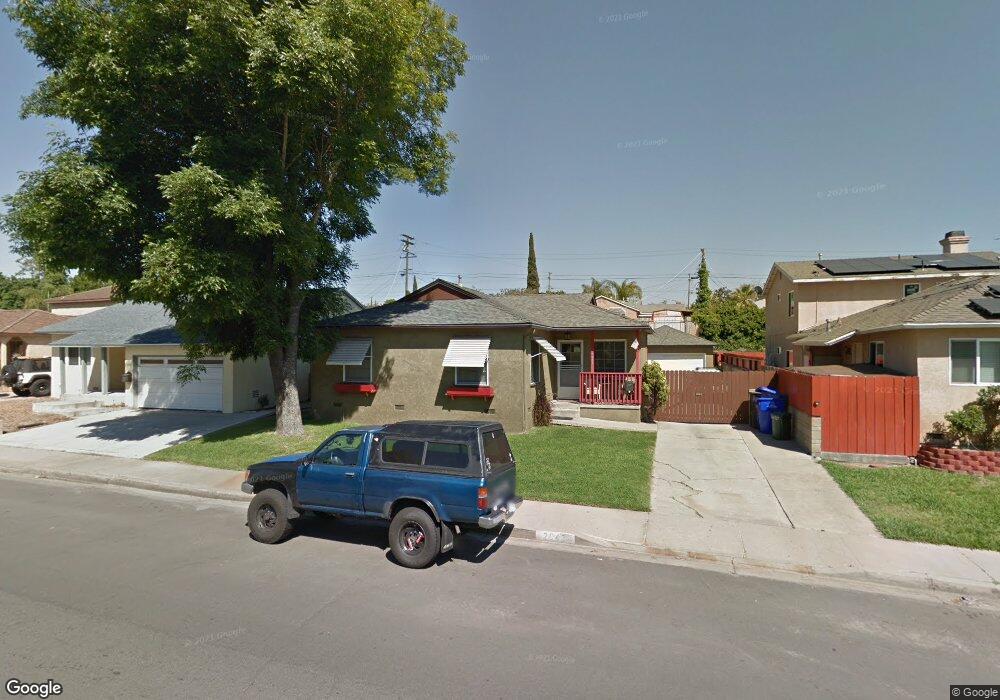
2043 Midvale Dr San Diego, CA 92105
Fairmount Park NeighborhoodEstimated Value: $622,000 - $801,000
3
Beds
1
Bath
1,020
Sq Ft
$709/Sq Ft
Est. Value
About This Home
This home is located at 2043 Midvale Dr, San Diego, CA 92105 and is currently estimated at $723,322, approximately $709 per square foot. 2043 Midvale Dr is a home located in San Diego County with nearby schools including Rowan Elementary School, Clark Middle School, and Herbert Hoover High School.
Ownership History
Date
Name
Owned For
Owner Type
Purchase Details
Closed on
Sep 20, 2021
Sold by
Angello Robert
Bought by
Angello Robert J and Angello Kathy J
Current Estimated Value
Purchase Details
Closed on
Jun 28, 2018
Sold by
Angello Michael
Bought by
Angello Michael M and Michael Angello Revocable Trus
Purchase Details
Closed on
Jun 1, 2006
Sold by
Angello Michael
Bought by
Angello Michael and Angello Robert
Purchase Details
Closed on
May 11, 1999
Sold by
Trust 08-20-91 Angello Samuel C & Michelle F and Angello Michelle F
Bought by
Angello Michelle F
Create a Home Valuation Report for This Property
The Home Valuation Report is an in-depth analysis detailing your home's value as well as a comparison with similar homes in the area
Home Values in the Area
Average Home Value in this Area
Purchase History
| Date | Buyer | Sale Price | Title Company |
|---|---|---|---|
| Angello Robert J | -- | None Available | |
| Angello Michael M | -- | None Available | |
| Angello Michael | -- | None Available | |
| Angello Michelle F | -- | -- |
Source: Public Records
Tax History Compared to Growth
Tax History
| Year | Tax Paid | Tax Assessment Tax Assessment Total Assessment is a certain percentage of the fair market value that is determined by local assessors to be the total taxable value of land and additions on the property. | Land | Improvement |
|---|---|---|---|---|
| 2025 | $1,466 | $118,848 | $39,148 | $79,700 |
| 2024 | $1,466 | $116,519 | $38,381 | $78,138 |
| 2023 | $1,433 | $114,235 | $37,629 | $76,606 |
| 2022 | $1,395 | $111,996 | $36,892 | $75,104 |
| 2021 | $1,386 | $109,801 | $36,169 | $73,632 |
| 2020 | $1,369 | $108,676 | $35,799 | $72,877 |
| 2019 | $1,346 | $106,547 | $35,098 | $71,449 |
| 2018 | $1,259 | $104,459 | $34,410 | $70,049 |
| 2017 | $80 | $102,412 | $33,736 | $68,676 |
| 2016 | $1,209 | $100,405 | $33,075 | $67,330 |
| 2015 | $1,191 | $98,898 | $32,579 | $66,319 |
| 2014 | $1,174 | $96,961 | $31,941 | $65,020 |
Source: Public Records
Map
Nearby Homes
- 1804 Colonial Ave
- 1720 Midvale Dr
- 4216 Posey Place
- 1742 Rowan St
- 2317 Shamrock St Unit 3
- 2382 Haller St
- 2170 Montclair St
- 2324 Montclair St
- 4183 Sycamore Dr
- 441 443 N 41st St
- 348 & 350 27th St
- 2537 Tuberose St
- 2541 Haller St
- 3686 Cactusview Dr
- 1505 Bridgeview Dr
- 3440 Fir St
- 1480 Bridgeview Dr
- 2094 Laurinda Place
- 3606 Maple St Unit 12
- 2609 Montclair St Unit 11
- 2035 Midvale Dr
- 2051 Midvale Dr
- 2027 Midvale Dr
- 2020 Rexford Dr
- 2059 Midvale Dr
- 2012 Rexford Dr
- 2028 Rexford Dr
- 2004 Rexford Dr
- 2036 Rexford Dr
- 2019 Midvale Dr
- 2067 Midvale Dr
- 2040 Midvale Dr
- 2048 Midvale Dr
- 2030 Midvale Dr
- 2058 Midvale Dr
- 1952 Rexford Dr
- 2044 Rexford Dr
- 2020 Midvale Dr
- 2011 Midvale Dr
- 2075 Midvale Dr