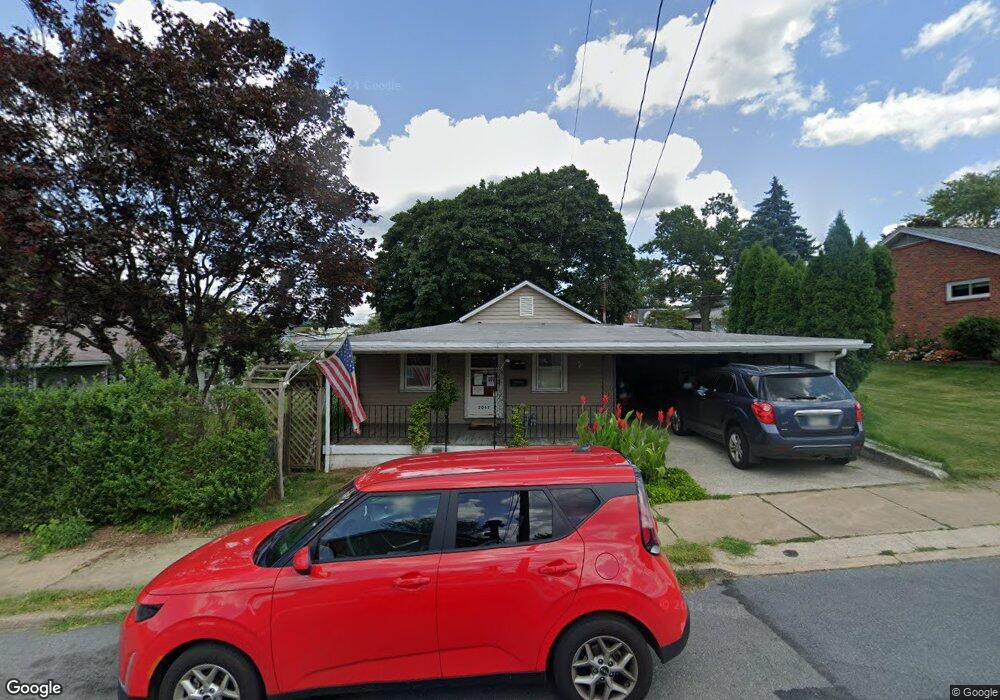
2043 S 3rd St Unit 2303 Allentown, PA 18103
Southside NeighborhoodEstimated Value: $230,000 - $262,217
2
Beds
1
Bath
1,218
Sq Ft
$208/Sq Ft
Est. Value
About This Home
This home is located at 2043 S 3rd St Unit 2303, Allentown, PA 18103 and is currently estimated at $253,804, approximately $208 per square foot. 2043 S 3rd St Unit 2303 is a home located in Lehigh County with nearby schools including Hiram W Dodd Elementary School, South Mountain Middle School, and Louis E. Dieruff High School.
Ownership History
Date
Name
Owned For
Owner Type
Purchase Details
Closed on
Feb 14, 2008
Sold by
Cruz Marilyn V
Bought by
Stetzel Danny J
Current Estimated Value
Home Financials for this Owner
Home Financials are based on the most recent Mortgage that was taken out on this home.
Original Mortgage
$129,000
Outstanding Balance
$81,709
Interest Rate
6.14%
Mortgage Type
New Conventional
Estimated Equity
$172,095
Purchase Details
Closed on
Feb 7, 2006
Sold by
Bess Howard C and Bess Alice V
Bought by
Bess Alice
Purchase Details
Closed on
Sep 27, 2002
Sold by
Aungst Daniel R and Aungst Pamela A
Bought by
Bess Howard C and Bess Alice
Home Financials for this Owner
Home Financials are based on the most recent Mortgage that was taken out on this home.
Original Mortgage
$45,000
Interest Rate
6.27%
Mortgage Type
Purchase Money Mortgage
Purchase Details
Closed on
Sep 10, 1991
Bought by
Aungst Daniel R and Aungst Pamela A
Create a Home Valuation Report for This Property
The Home Valuation Report is an in-depth analysis detailing your home's value as well as a comparison with similar homes in the area
Home Values in the Area
Average Home Value in this Area
Purchase History
| Date | Buyer | Sale Price | Title Company |
|---|---|---|---|
| Stetzel Danny J | $129,000 | -- | |
| Bess Alice | -- | None Available | |
| Bess Howard C | $87,000 | -- | |
| Aungst Daniel R | $78,000 | -- |
Source: Public Records
Mortgage History
| Date | Status | Borrower | Loan Amount |
|---|---|---|---|
| Open | Stetzel Danny J | $129,000 | |
| Previous Owner | Bess Howard C | $45,000 |
Source: Public Records
Tax History Compared to Growth
Tax History
| Year | Tax Paid | Tax Assessment Tax Assessment Total Assessment is a certain percentage of the fair market value that is determined by local assessors to be the total taxable value of land and additions on the property. | Land | Improvement |
|---|---|---|---|---|
| 2025 | $4,285 | $116,700 | $35,700 | $81,000 |
| 2024 | $4,285 | $116,700 | $35,700 | $81,000 |
| 2023 | $4,285 | $116,700 | $35,700 | $81,000 |
| 2022 | $4,152 | $116,700 | $81,000 | $35,700 |
| 2021 | $4,078 | $116,700 | $35,700 | $81,000 |
| 2020 | $3,985 | $116,700 | $35,700 | $81,000 |
| 2019 | $3,928 | $116,700 | $35,700 | $81,000 |
| 2018 | $3,597 | $116,700 | $35,700 | $81,000 |
| 2017 | $3,516 | $116,700 | $35,700 | $81,000 |
| 2016 | -- | $116,700 | $35,700 | $81,000 |
| 2015 | -- | $116,700 | $35,700 | $81,000 |
| 2014 | -- | $116,700 | $35,700 | $81,000 |
Source: Public Records
Map
Nearby Homes
- 2441 S 4th St
- 206 208 W Emaus Ave
- 2429 S Front St
- 2421 S Wood St
- 316 W Mountain Rd
- 121 Woodcrest Cir
- 2416 S Alice St Unit 2418
- 2347 S Law St Unit 2349
- 566 W Emaus Ave
- 566 588 W Emaus Ave
- 1852 S 2nd St
- 102 W Brookdale St
- 148 W Brookdale St
- 2413 S Church St
- 2401 S Church St
- 1865 Chapel Ave
- 203 W Brookdale St
- 618 Clifford St
- 642 W Emaus Ave
- 135 W Wabash St
- 2041 S 3rd St
- 2303 S 3rd St Unit 2311
- 2035 S 3rd St Unit 2037
- 2031 S 3rd St Unit 2033
- 2304 S 3rd St
- 2311 S 3rd St Unit 2317
- 2044 S 3rd St
- 2042 S 2nd St Unit 2046
- 2302 S 3rd St Unit 2306
- 2046 S 3rd St Unit 2
- 2046 S 3rd St Unit 2048
- 2030 S 2nd St
- 2050 S 2nd St
- 2042 S 3rd St Unit 2044
- 2308 S 3rd St Unit 2312
- 2028 S 2nd St
- 2036 S 2nd St Unit 2040
- 2025 S 3rd St Unit 2029
- 2052 S 2nd St
- 2032 S 3rd St Unit 2040