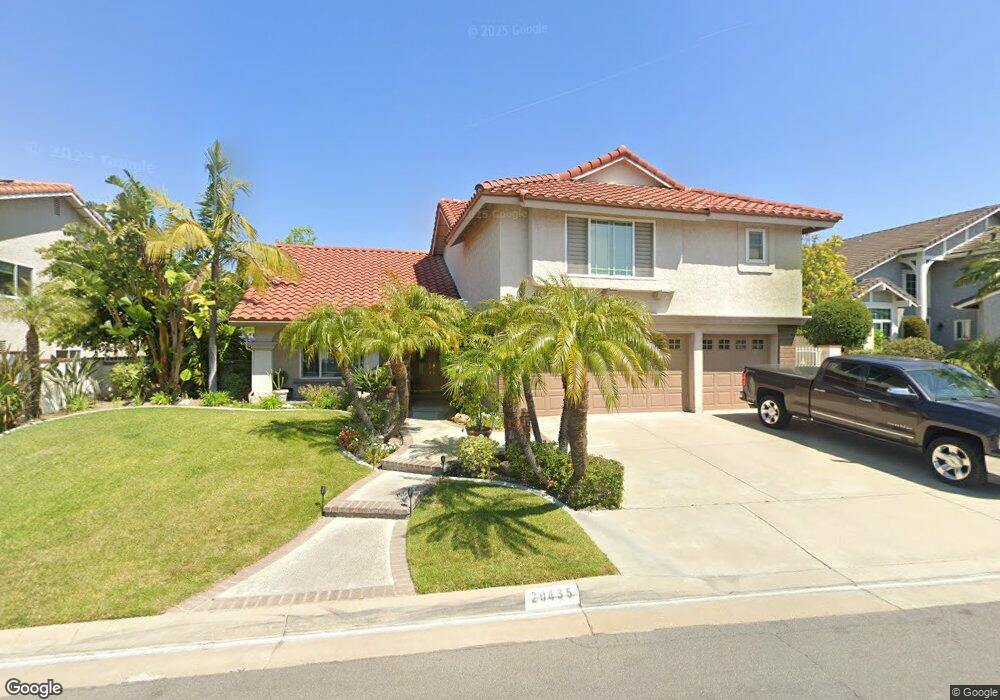
20435 Via Sonador Yorba Linda, CA 92886
Estimated Value: $1,508,807 - $1,808,000
4
Beds
3
Baths
2,477
Sq Ft
$669/Sq Ft
Est. Value
About This Home
This home is located at 20435 Via Sonador, Yorba Linda, CA 92886 and is currently estimated at $1,657,702, approximately $669 per square foot. 20435 Via Sonador is a home located in Orange County with nearby schools including Fairmont Elementary, Bernardo Yorba Middle School, and Ivycrest Montessori Private School - Yorba Linda.
Ownership History
Date
Name
Owned For
Owner Type
Purchase Details
Closed on
Nov 20, 2015
Sold by
Flemmer Steve L and Flemmer Kellie A
Bought by
Flemmer Family Trust
Current Estimated Value
Purchase Details
Closed on
Aug 29, 1994
Sold by
Ge Capital Asset Management Corp
Bought by
Flemmer Steve L and Flemmer Kellie A
Home Financials for this Owner
Home Financials are based on the most recent Mortgage that was taken out on this home.
Original Mortgage
$246,400
Interest Rate
8.57%
Purchase Details
Closed on
Nov 24, 1993
Sold by
Robert E Weiss Inc
Bought by
Texas Commerce Bank National Assn
Create a Home Valuation Report for This Property
The Home Valuation Report is an in-depth analysis detailing your home's value as well as a comparison with similar homes in the area
Home Values in the Area
Average Home Value in this Area
Purchase History
| Date | Buyer | Sale Price | Title Company |
|---|---|---|---|
| Flemmer Family Trust | -- | None Available | |
| Flemmer Steve L | $308,000 | Old Republic Title Company | |
| Texas Commerce Bank National Assn | $263,500 | Fidelity National Title Ins |
Source: Public Records
Mortgage History
| Date | Status | Borrower | Loan Amount |
|---|---|---|---|
| Closed | Flemmer Steve L | $246,400 |
Source: Public Records
Tax History Compared to Growth
Tax History
| Year | Tax Paid | Tax Assessment Tax Assessment Total Assessment is a certain percentage of the fair market value that is determined by local assessors to be the total taxable value of land and additions on the property. | Land | Improvement |
|---|---|---|---|---|
| 2025 | $6,924 | $569,353 | $229,759 | $339,594 |
| 2024 | $6,924 | $558,190 | $225,254 | $332,936 |
| 2023 | $6,789 | $547,246 | $220,838 | $326,408 |
| 2022 | $6,691 | $536,516 | $216,508 | $320,008 |
| 2021 | $6,562 | $525,997 | $212,263 | $313,734 |
| 2020 | $6,455 | $520,604 | $210,086 | $310,518 |
| 2019 | $6,199 | $510,397 | $205,967 | $304,430 |
| 2018 | $6,144 | $500,390 | $201,929 | $298,461 |
| 2017 | $6,040 | $490,579 | $197,970 | $292,609 |
| 2016 | $5,918 | $480,960 | $194,088 | $286,872 |
| 2015 | $5,840 | $473,736 | $191,173 | $282,563 |
| 2014 | $5,673 | $464,457 | $187,429 | $277,028 |
Source: Public Records
Map
Nearby Homes
- 20455 Via Cadiz
- 5289 Via Andalusia
- 5505 Calle Vista Linda
- 20770 Paseo de la Rambla
- 4832 Via Frondosa
- 20709 Calle Pera
- 4710 Avenida Del Este
- 20660 Calle Feliz
- 19862 Le Mans Cir
- 5795 Via Perla
- 5317 Via Ramon Rd
- 19831 Caprice Dr
- 5244 Via Ramon Rd
- 21590 Via Pepita
- 20520 Via Magdalena
- 4545 Avenida Rio Del Oro
- 19761 Burleigh Dr
- 4418 Avenida Del Este
- 20681 Via Amarilla
- 19762 Ridgewood Place
- 20445 Via Sonador
- 20425 Via Sonador
- 20415 Via Sonador
- 20455 Via Sonador
- 20440 Via Sonador
- 20450 Via Sonador
- 20430 Via Sonador
- 20460 Via Sonador
- 5250 Via Cartagena
- 20465 Via Sonador
- 20405 Via Sonador
- 5305 Via Santander
- 20445 Via Cristal
- 20435 Via Cristal
- 5300 Via Cartagena
- 5305 Via Primaria
- 5325 Via Primaria
- 5285 Via Primaria
- 5315 Via Santander
- 20455 Via Cristal